

Prove a Single Pane of Glass in 90 Days for IT LeadersA single pane of glass is one operational view that pulls metrics, logs, traces, and alerts from every system into a place your team actually watches. The catch: it only works when the data underneath it is accurate. Bolt a dashboard onto a stale asset inventory or mismatched tags, and you've just built a prettier version of the same blind spots you had before.
TL;DR:
- A single pane of glass relies on accurate, up-to-date discovery data and consistent tagging to truly unify metrics, logs, and traces across systems.
- Outdated or incomplete asset inventories and timestamp mismatches can cause dashboards to show incorrect information, undermining trust and effectiveness.
- Successful implementation requires focused pilot testing on critical services, verifying incident correlation, and ensuring owner accountability before broader rollout.
- Many projects fail due to poor data quality and lack of ownership for connectors and runbooks, not because of the dashboard technology itself.
- In multi-site environments, operational discipline, clear ownership, and SLA-driven access are essential to prevent stale data from disrupting cross-region visibility.
Table of Contents
- What Counts as a Single Pane of Glass?
- What Benefits Should You Actually Expect?
- Why Do Single Pane of Glass Projects Fail?
- How Should the Data Model Actually Be Built?
- What Should a 90-Day Pilot Actually Test?
- When Should You Keep Separate Systems Instead?
- What Multi-Site Operations Teams Get Wrong About Consolidation
- Ready to Fix the Data Layer, Not Just the Dashboard?
- Sources
What Counts as a Single Pane of Glass?
A real single pane of glass pulls together several distinct telemetry types, not just one feed dressed up with a new front end. IBM defines it as a centralized tool that integrates disparate data sources into one view for monitoring performance, security, and system health in real time. That definition sounds simple until you list what "disparate" actually includes.
A functioning setup typically aggregates:
- Metrics — CPU, bandwidth, latency, error rates
- Logs — application, security, and system event streams
- Traces — request paths across distributed services
- Alerts and events — threshold breaches, anomaly flags, status changes
- Synthetics — scripted checks that simulate user transactions
- Asset and inventory feeds — what exists, where it lives, who owns it
On the display side, you're looking at dashboards, service maps, alert consoles, and role-specific views so a network engineer and a CFO aren't staring at the same screen wondering what matters. Underneath all of it, integration runs on APIs, webhooks, and exporters. OpenTelemetry has become the closest thing to a common language for correlating metrics, logs, and traces across vendors without custom glue code for every source.
What Benefits Should You Actually Expect?
The payoff of a working single pane of glass isn't abstract. Webopedia notes that consolidating metrics, logs, and traces into one operational view shortens the time between detection and resolution, because teams stop hunting across five tools to confirm what already happened.
The gains show up in a few concrete places:
- Faster mean time to detect and repair, since triage starts from one correlated timeline instead of five disconnected ones
- Shared evidence across DevOps, SecOps, and ITOps, so incident calls stop opening with "can everyone pull up their own tool first"
- Cleaner executive reporting on SLA compliance, since leadership sees the same numbers ops teams are already working from
- Fewer platform switches per incident, which cuts the cognitive tax of context switching during an outage
Pro Tip: Track how many tools your on-call engineer opens during a real incident this quarter. If it's more than two or three, that's your actual baseline for measuring whether a SPOG rollout helped.
The tools matter less than the discipline behind them. A dashboard that reduces five browser tabs to one, but still requires someone to manually reconcile timestamps, hasn't solved the problem. It's relocated it.
Why Do Single Pane of Glass Projects Fail?
Most failures trace back to the data layer, not the dashboard. Virima's analysis is blunt about this: building a unified view on top of a stale configuration management database just centralizes bad information faster. You get one screen showing you the wrong thing instead of five.
Common failure patterns include:
- Missing or outdated discovery, so the dashboard shows assets that no longer exist or misses ones that do
- Inconsistent tagging and entity mismatches, which break correlation between a service, its host, and its logs
- Timestamp drift across sources, making trace to log drill-down unreliable during an actual incident
- The automation gap: Stitchflow found roughly 20 to 40% of business apps lack SCIM or usable APIs, leaving teams stuck bridging that gap with manual work or fragile scripts
- Alert fatigue from dashboards nobody prunes, with no runbooks telling anyone what to do once an alert fires
Pro Tip: Before evaluating any monitoring platform, audit how many of your critical apps actually expose a usable API. That number tells you more about your realistic timeline than any vendor demo will.
How Should the Data Model Actually Be Built?
Design the data layer before you touch the display layer. Virima's core argument holds here too: discovery-sourced runtime truth beats a display-only dashboard every time, because the dashboard is only as honest as the inventory feeding it.
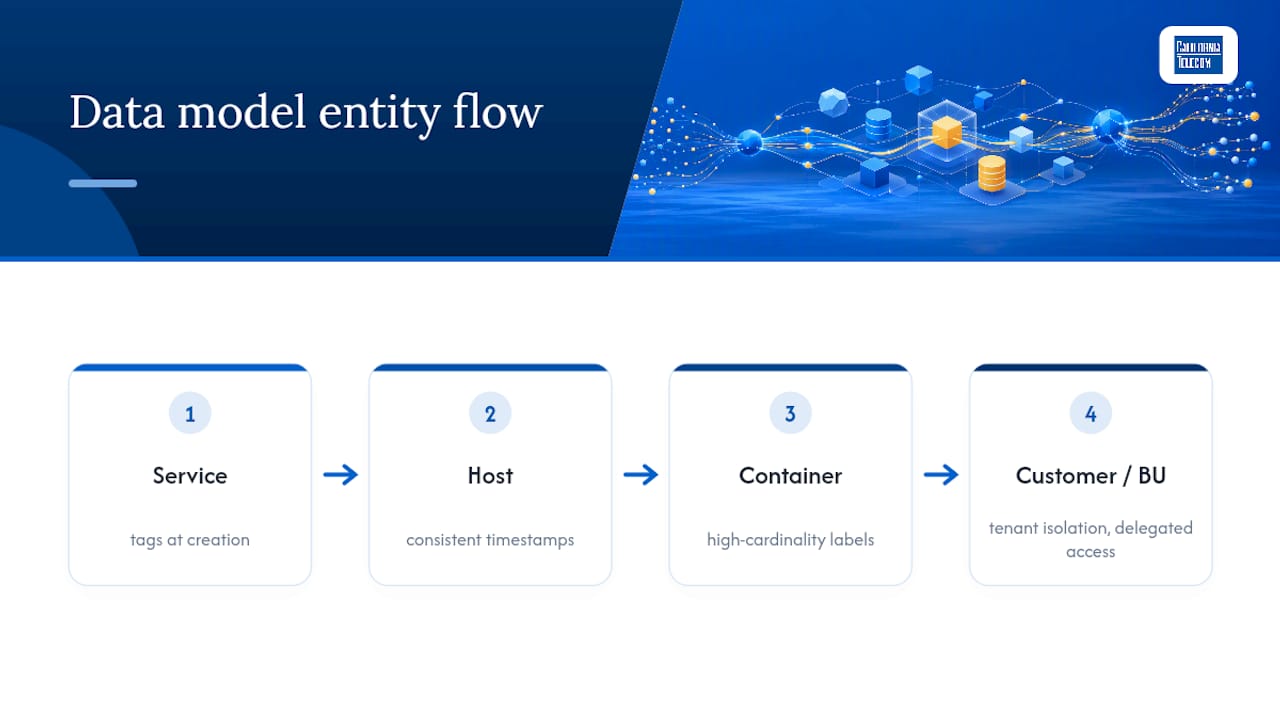
That means building an entity model with clear relationships. A service maps to a host, which maps to a container, which maps to a customer or business unit, all connected through standard tags applied consistently at creation, not retrofitted later. Skip this step and you'll spend more time fixing broken joins than fixing incidents.
Correlation depends on a few unglamorous details: consistent timestamps across every source, high-cardinality labels that don't collapse distinct services into one bucket, and mapping relationships that survive when infrastructure changes, as explained in proxy authentication methods for teams and infrastructure. For managed service providers or any multi-site organization, tenant isolation matters just as much. Delegated access needs to let a regional team see their own environment without exposing another site's data, and without forcing every user through the same flat permission model. A network observability approach that separates what teams can see from what they can control tends to hold up better under audit than one that treats visibility and access as the same thing.
What Should a 90-Day Pilot Actually Test?
Don't attempt an enterprise-wide rollout on day one. FiveNines recommends starting with two or three critical services and running specific acceptance tests before declaring victory.
- Scope the pilot. Pick services where an outage actually hurts revenue or compliance, and map their full telemetry sources.
- Run the tag propagation test. Confirm a single service tag appears unchanged from the originating agent all the way to the dashboard.
- Test trace to log drill-down. An engineer should get from a slow trace to the specific log line causing it in under a minute.
- Test incident consolidation. Trigger a correlated failure and confirm the system produces one actionable incident, not a dozen separate pages for the same root cause.
- Assign owners and retire noisy alerts. Every surviving alert needs a named owner and a published runbook.
- Run a cost stress test. Simulate high-cardinality label traffic to check ingest costs and set retention limits before they surprise you on the invoice.
Pro Tip: If your pilot can't pass the incident consolidation test after 90 days, don't expand scope. Fix the tagging first. Adding more services to a broken correlation model just multiplies the noise.
When Should You Keep Separate Systems Instead?
Consolidation isn't always the right call. Hardware teams running deep vendor-specific diagnostics, or cloud teams optimizing for CI/CD speed, often lose more than they gain when forced into one generic interface. ITOps Times argues for a middle path: unify observation and service mapping across teams, but leave specialized control planes intact where deep tooling actually matters.
Watch for a specific warning sign: if your team increasingly logs into the underlying tool anyway to get real answers, the unified view has become overhead, not insight. That's your cue to scale back the consolidation, not push harder into it.
What Multi-Site Operations Teams Get Wrong About Consolidation
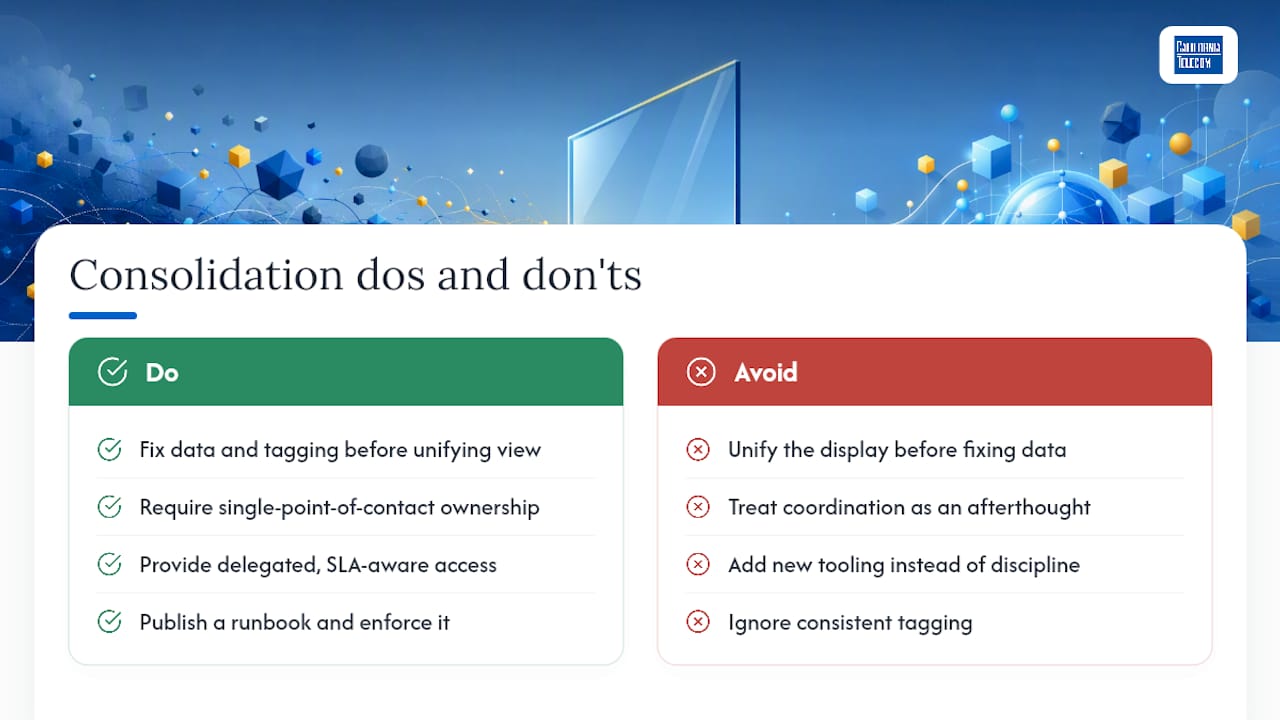
Every SPOG failure I've seen traces back to the same root cause: someone unified the display before fixing the data underneath. Multi-site organizations feel this hardest, because a single stale CMDB entry at one location can throw off correlation for an entire regional rollup.
The organizations that get this right treat single-point-of-contact coordination and delegated, SLA-aware access as design requirements, not afterthoughts. Californiatelecom's 24/7 U.S.-based NOC and 99.99% uptime SLA on data exist because multi-site visibility only holds up if someone owns the response, not just the dashboard. One team we've supported cut incident escalation time significantly simply by pairing consistent tagging with a published runbook, no new tooling required. The fix was operational discipline, not another pane of glass.
— Jim
Ready to Fix the Data Layer, Not Just the Dashboard?
Most single pane of glass projects stall on the same gap: nobody owns the connectors, the runbooks, or the 2 AM page when three systems disagree about what's actually broken. That's the part a dashboard can't fix on its own, and it's exactly where a managed provider earns its keep.Californiatelecom runs multi-site networks with one point of contact, a 24/7 U.S.-based NOC, and a 99.99% uptime SLA on data, backed by Netverge monitoring that ties telemetry to real ownership instead of another unmonitored screen. Sourcing across 50+ carriers means the connectivity layer feeding your dashboard is actually reliable, not just visible. If your current setup shows you problems without anyone accountable for solving them, request a consultation and find out what a properly operationalized network actually looks like.
Sources
- What is Single Pane of Glass? | IBM
- What “Single Pane of Glass” Actually Means in IT — Virima
- Single Pane of Glass for IT — Stitchflow
- Single Pane of Glass Monitoring: A Practical Guide — FiveNines
- Single Pane of Glass Monitoring - SigNoz