🏆 2025 MSP 501 Next Generation List — Recognized for Innovation in Managed Services. Learn more
(877) 622-5835Netverge Monitoring
Fully Managed Network Monitoring — We Watch Your Network So You Don't Have To
Noisy monitoring gets ignored. That's a liability. California Telecom deploys and operates Netverge, an AI-powered monitoring platform with 28+ intelligent sensors, unified observability, and automated event triage. We fully onboard your network, configure every device, set up alerting and reporting, and give you portal access. All you do is sit back and receive proactive notifications when something needs attention.
Key Benefits
Observability From Every Angle
The Netverge platform monitors your infrastructure through four complementary methods, ensuring nothing falls through the cracks.
Infrastructure Health
- Device status & availability
- Hardware health metrics
- Firmware tracking
Network Paths
- Latency & packet loss
- Jitter measurement
- Path change detection
Device Resources
- CPU, memory, disk
- Interface utilization
- Process monitoring
User Experience
- Synthetic transactions
- Web performance (CWV)
- WiFi signal quality
Sensors in Action
From network switches to cloud costs to SSL certificates, every sensor delivers rich, actionable data in a unified interface.

FortiSwitch Probe
Monitor Fortinet switch health, port status, PoE, and firmware in real time. The port map visualizes active connections at a glance with per-port speed indicators.
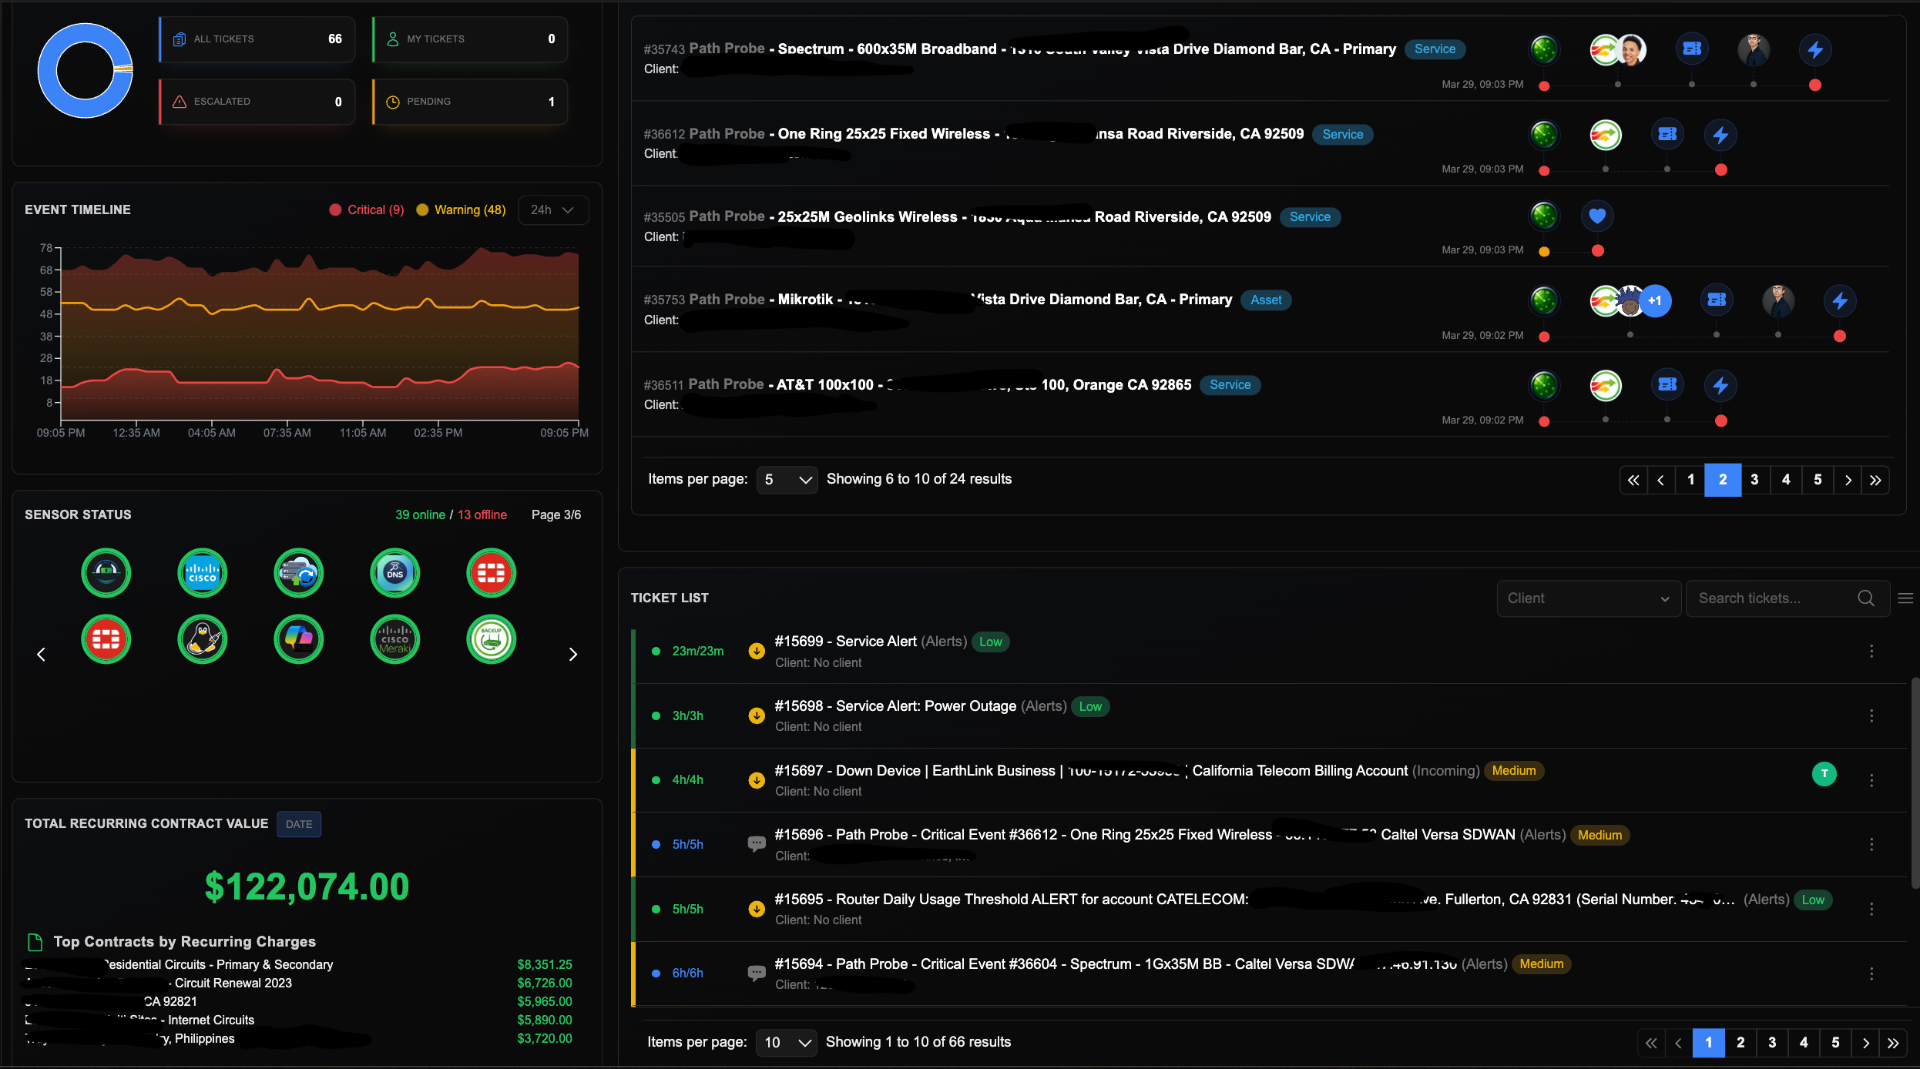
Path Monitoring & Event Triage
Monitor network paths with latency, packet loss, and jitter metrics. When thresholds are breached, events are automatically triaged and escalated.
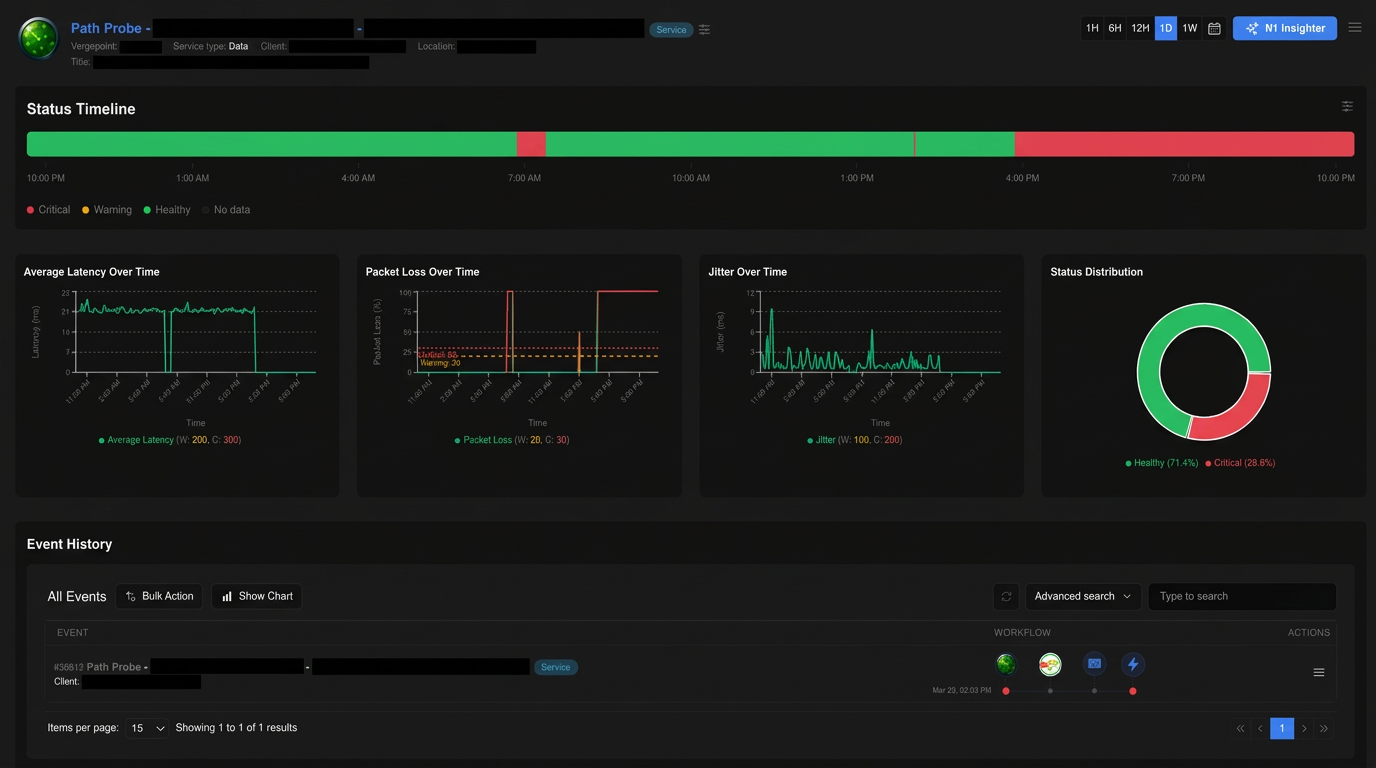
Path Probe Overview
Status timeline with latency, packet loss, jitter trends, status distribution, and correlated event history from a single path sensor.
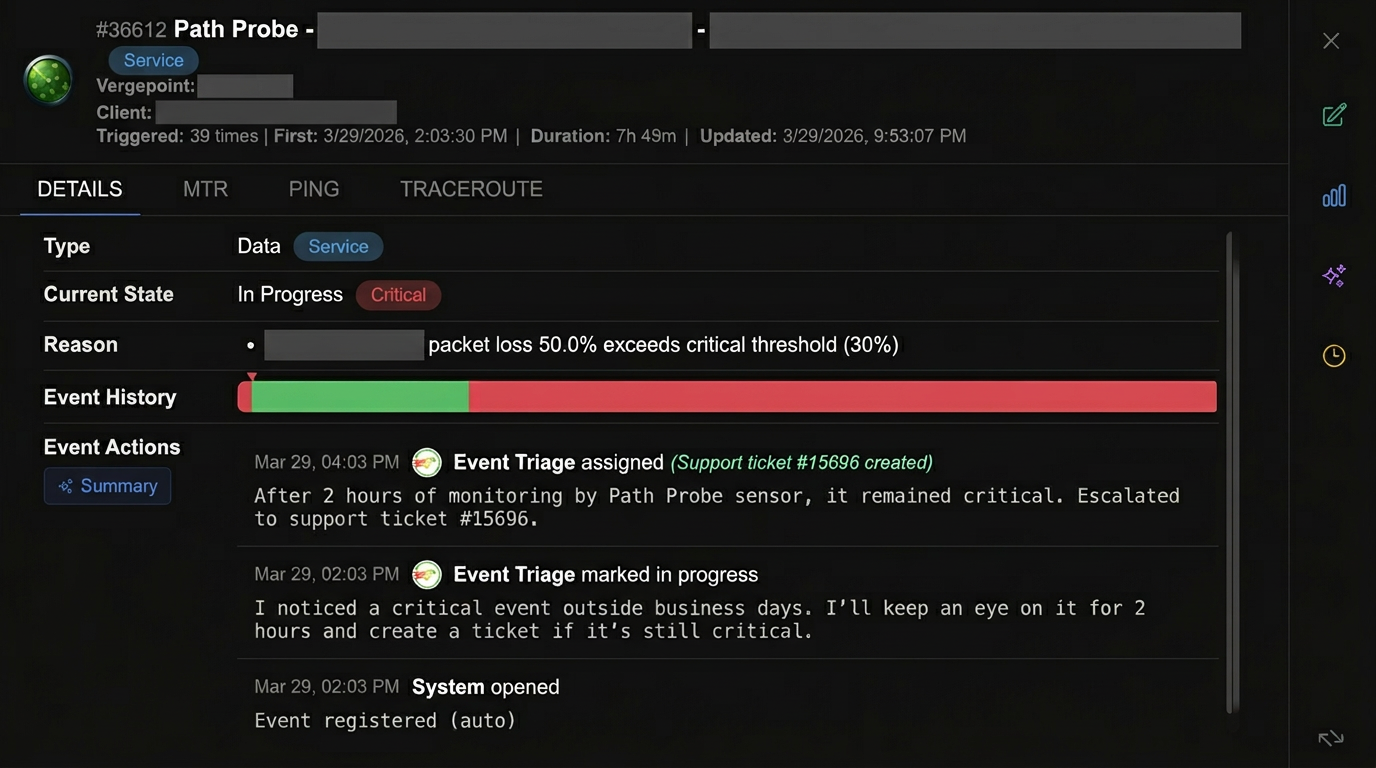
Automated Event Triage
AI-powered Event Triage monitors critical events, creates support tickets after sustained issues, and documents every action taken. Fully automated.
Every Event. Tracked. Correlated. Resolved.
Workflow Phases
Track events through their complete lifecycle with clear status indicators from detection to resolution.
Ticket Actions
Automatically create and associate support tickets from monitoring events with full context attached.
Ownership Tracking
Clear ownership and accountability for every event. Your dedicated California Telecom engineer owns the resolution.
28 Purpose-Built Monitoring Sensors
Our monitoring platform deploys specialized sensors across every layer of your IT stack — from cloud costs and BGP routing to SSL certificates and WiFi health. Each sensor is engineered for a single job and does it exceptionally well.
Cloud & SaaS Monitoring
Full visibility into your cloud platforms and SaaS applications — costs, performance, and availability.
Daily AWS cost and usage analysis across your entire account with FinOps-grade dashboards and cost breakdowns.
Per-instance Amazon EC2 monitoring via CloudWatch and EC2 API. Discover all instances in your AWS account/region.
Daily Azure cost and usage analysis across your subscription with FinOps-grade dashboards and cost breakdowns.
Network & Routing
Monitor every hop, path, and protocol across your WAN and LAN — from BGP peering to SNMP device health.
Monitors BGP routing health: prefix visibility, AS path changes, route leak detection, hijack detection, prefix count, and community attributes.
Per-device Cisco Meraki monitoring via Dashboard API. Discover all devices in your organization.
Monitors MikroTik RouterOS devices via SSH: interfaces, routing (BGP/OSPF), firewall, NAT, IPsec, netwatch, SLA pinning.
Security & Compliance
Proactive security monitoring — from certificate expiry to vulnerability scanning and firewall fabric health.
Monitors SSL/TLS certificates for expiry, chain validity, cipher strength, OCSP status, and CT log presence.
Enterprise Fortinet Security Fabric monitor. Discovers and monitors FortiGate firewalls, FortiAP access points, and more.
Enterprise-grade deep vulnerability scanner with full OpenVAS/GVM stack and Nmap integration for comprehensive security assessment.
Server & Infrastructure
Deep system-level monitoring for Linux, Cisco, and Windows servers — CPU, memory, disk, processes, and services.
Monitors Cisco IOS/IOS-XE devices via SSH with NTC-templates structured parsing: interfaces, BGP, OSPF, HSRP, and more.
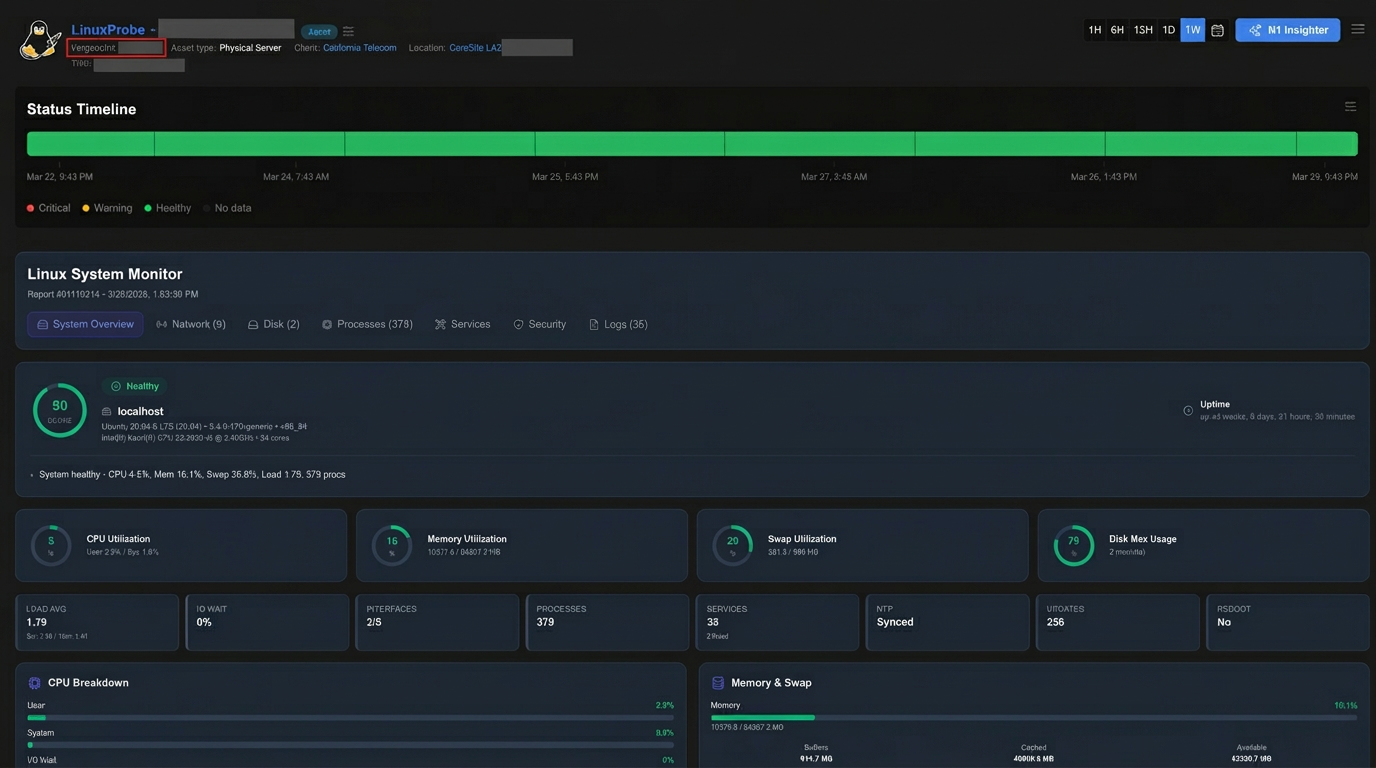
Enterprise Linux system health sensor. Collects CPU, memory, disk, network, processes, systemd services, and security posture.
Windows Server health and compatibility sensor over WinRM. Collects OS compatibility, CPU/memory/disk usage, and system diagnostics.
Web & API Monitoring
Ensure your websites and APIs are fast, available, and healthy with real-time performance and uptime checks.
Generic REST API health sensor. Monitors HTTP/HTTPS endpoints with configurable method, headers, body, and response validation.
Enterprise-grade website performance monitoring with Core Web Vitals, frame-by-frame capture, QoE metrics, and more.
Monitors DNS health: resolution time, record accuracy, propagation consistency across resolvers, DNSSEC validation.
Backup & Configuration
Automated config backup and change tracking for routers, switches, firewalls, and any CLI-accessible device.
Vendor-agnostic network device configuration backup over SSH. Supports any CLI-accessible device — routers, switches, firewalls.
Backs up MikroTik router configuration and key command outputs over SSH for disaster recovery and audit compliance.
Wireless & Connectivity
Monitor WiFi health, 4G/LTE routers, and wireless connectivity across your sites.
Monitors WiFi connection health, including signal strength and bitrate for wireless performance visibility.
Monitors WTI 4G routers for connectivity, signal, usage, and latency across cellular backup links.
Enterprise-grade network and system diagnostics agent with comprehensive WiFi scanning, performance metrics, and troubleshooting.
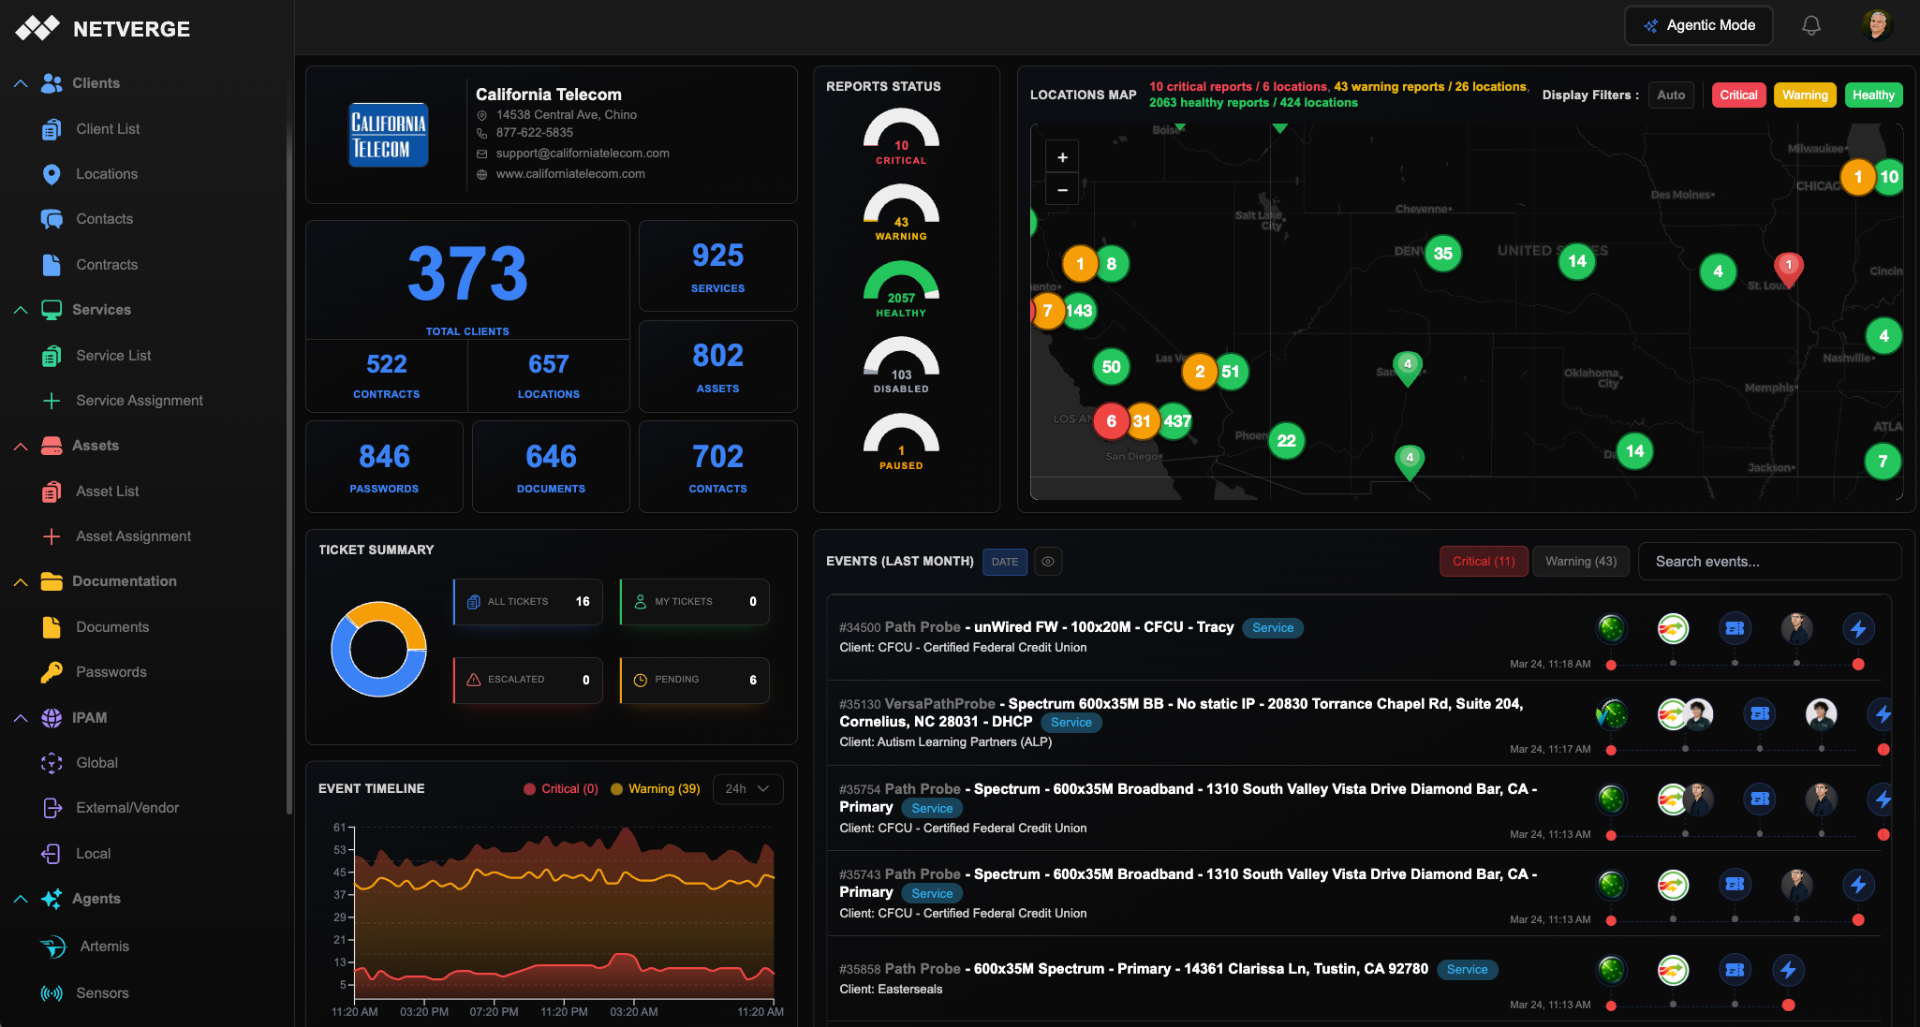
See It in Action
Real screenshots from the Netverge Monitoring platform

How Managed Monitoring Works
You don't need to become a monitoring expert. California Telecom handles everything. We start with a full discovery of your network: routers, switches, firewalls, access points, servers, cloud infrastructure, and circuits. Our engineers configure sensors, set alerting thresholds, build custom dashboards, and connect monitoring to our ticketing and operations workflow. Once live, you get portal access as a user and proactive notifications when something needs attention. That's it.
Monitoring Sensors: Four-Way Observability
Observability starts with sensors placed where it matters. The platform uses four-way monitoring to cover every angle: infrastructure health sensors track device status, availability, and hardware metrics. Network path sensors measure latency, packet loss, and jitter across your WAN. Device resource sensors monitor CPU, memory, disk, and interface utilization. Synthetic sensors simulate real user experience to catch problems before your team notices them.
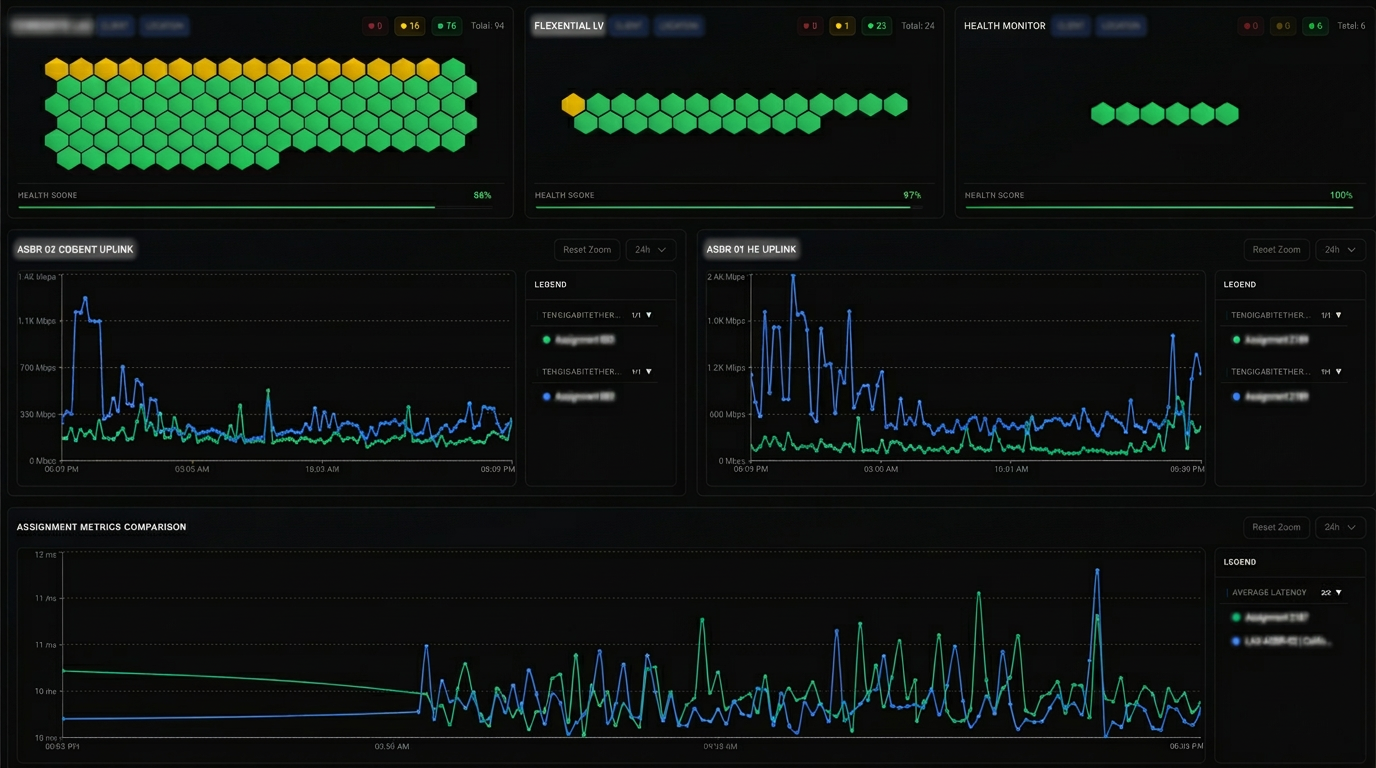
Unified Observability: One Operational View
Sensor data is automatically unified and correlated into a single operational view. Centralized telemetry ingestion pulls metrics from every monitored device and service. Automatic event correlation links related alerts across systems so we see root causes, not symptoms. Every data point is tied to your organization, your sites, and your services with time-aligned visibility across your entire stack.
Automated Event Triage
When thresholds are breached, the platform's AI-powered Event Triage engine evaluates events against your rules. Sustained issues automatically generate support tickets assigned to a California Telecom engineer who knows your network. Every action is documented. Every event is tracked through its complete lifecycle: detection, acknowledgment, investigation, and resolution. You receive proactive communication throughout.
28+ Sensors for Your Entire Stack
The sensor catalog covers every layer of modern IT. MerakiProbe and UniFiProbe monitor your wireless infrastructure through native APIs. FortiProbe watches your entire Fortinet Security Fabric. AWS and Azure probes track compute performance and cloud costs. CertWatch monitors SSL/TLS certificates. SNMP Scout, CiscoIOSProbe, and MikroTikProbe collect device-level telemetry. LinuxProbe and Windows Server Probe cover your servers. ConfigBackup saves device configurations automatically. Each sensor is purpose-built and delivers rich, actionable data.
Your Network, Our Engineers
Netverge is the platform. California Telecom is the team behind it. Our engineers deploy every sensor, configure every alerting threshold, tune every correlation rule, and respond to events 24/7. When a problem is detected, you get an engineer who knows your network, not a generic help desk. We handle the entire monitoring lifecycle from setup through daily operations so you can focus on running your business.
Frequently Asked Questions
What does 'fully managed' actually mean?
It means we do everything. We discover your network assets, configure every sensor, set up alerting thresholds, build your dashboards, and monitor 24/7/365. You get portal access to view your network health anytime, and we proactively notify you when something needs attention. You never touch the monitoring platform unless you want to.
What devices and platforms can you monitor?
Virtually everything. Our 28+ sensors cover Cisco Meraki, Fortinet, MikroTik, Ubiquiti UniFi, Versa SD-WAN, AWS, Azure, Microsoft 365, VMware vCenter, Linux servers, Windows servers, and any device supporting SNMP v2c/v3, SSH, or REST APIs. We also monitor websites, APIs, DNS, SSL certificates, BGP routing, and WiFi health.
How long does onboarding take?
Most networks are fully onboarded within 1-2 weeks. We start with a discovery session to map your environment, then our engineers configure sensors and alerting in parallel. You get portal access as soon as the first sensors are live, and we continue adding devices until full coverage is achieved.
What happens when a problem is detected?
The platform's Event Triage engine evaluates events against your thresholds and correlation rules. Sustained issues automatically generate support tickets assigned to a California Telecom engineer who knows your network. Every action is documented, and you receive proactive communication throughout the resolution process.
Do I get access to the monitoring portal?
Yes. You get full portal access with real-time dashboards, event history, reports, and device status views. You can check your network health anytime, but you don't have to. We watch it for you and notify you proactively when something needs attention.
How is this different from basic SNMP monitoring?
Basic SNMP monitoring gives you interface up/down and bandwidth graphs. Netverge goes far deeper with vendor-specific API integrations that pull structured telemetry from Meraki dashboards, FortiGate security fabric, MikroTik routing tables, and cloud provider APIs. Cross-system correlation means a spike in latency on your SD-WAN is automatically linked to the BGP route change that caused it.
Your Next Three Steps
Reach Out
Whether it's slow infrastructure or critical downtime, we're here to listen.
We Craft a Solution
After understanding your specific challenges, we provide a customized quote, often the same day.
Get Back to Business
With our solution in place, you can focus on what really matters: growing your business.
Trusted by Businesses Across California
"We really appreciate the professionalism and clear communication California Telecom brings as our managed service provider across network infrastructure, SecOps, and the rest of the backend."
Joe Fancher
Jack Nadel Inc.
"California Telecom customer service is a shining example of what every service provider should offer. Our IT Production Services division is fully dependent on the internet. We've been a California Telecom customer for at least 7 years, and I'm amazed with the support team and level of service."
Oscar Navarro
Sony Pictures
"Long-time customer of California Telecom here, and I can say from experience that these guys are the definition of responsive. I can call or email and within minutes, have a Tier 2 engineer on the line troubleshooting the issue."
Danny Rodriguez
Lanair Group
"California Telecom has demonstrated commitment over the years, providing excellent 24/7 support and services with their T1's, VoIP service, and co-location service. They are as much a part of our business as our customers are."
Hanns Schweis
Thermal Dynamics
"We use California Telecom hosted voice and internet. Very happy since we migrated from traditional carriers like Time Warner and AT&T. Always pass on the referrals if anyone is asking for an ISP."
Vitaliy Sklyar
Netpower
"Service has always been prompt and professional, and I am yet to have any downtime. Much better than Charter and AT&T, who I suffered with for years prior."
Atilla Banoczy
Lanair Group
Netverge Monitoring serving businesses across Southern California: Los Angeles · Orange County · Inland Empire · San Bernardino County · Riverside County · San Diego County · Ventura County · Nationwide