
Network Observability vs Monitoring: What Network Teams NeedMonitoring tells you when a device you already know about crosses a threshold you already defined. Observability lets you ask questions you never thought to ask, using correlated telemetry that spans the whole path. Both rest on the same three pillars: metrics, logs, and traces. The W3C trace-context standard is now widely used to stitch trace data across system boundaries.
The practical move: build monitoring first. Every network needs alerting on latency, packet loss, and interface errors. Add observability once your team is drowning in unknown incidents, running distributed or multi-site infrastructure, or losing hours to manual correlation across five different dashboards. California Telecom's Netverge platform is built around exactly that transition, pairing managed monitoring with correlated telemetry in a single view.
- Small, single-site network with predictable traffic? Monitoring alone usually covers you.
- Multi-location, cloud-connected, or SD-WAN environment? You need observability to catch what monitoring can't see.
- Already fighting alert fatigue? That's the clearest sign observability is overdue.
Key Takeaways
Monitoring catches known problems fast; observability adds the correlated telemetry needed to solve the unknown ones without burning hours in manual cross-tool investigation.
| Point | Details |
|---|---|
| Monitoring is the foundation | Deploy SNMP, NetFlow, syslog, and synthetic checks before layering on anything else. |
| Observability solves unknowns | Add correlated metrics, logs, and traces once recurring incidents lack a clear root cause. |
| Watch the scale signals | Multi-site architecture and climbing mean time to resolution both justify the observability investment. |
| Fight fatigue with correlation | Group alerts and tie thresholds to SLOs instead of raw counters to cut noise. |
| Managed option available | California Telecom's Netverge platform pairs 50+ carrier sourcing with a 24/7 NOC for single-dashboard observability. |
Table of Contents
- Network Observability vs Monitoring: The Core Definitions
- What Network Observability Actually Means
- Metrics, Logs, Traces, and the Network Telemetry You Need
- How Monitoring and Observability Actually Differ in Practice
- When to Use Each One, and How to Run Both Together
- Building an Observability Rollout Without Breaking Your Budget
- The Pitfalls That Undermine Observability Projects
- What a Managed Observability Approach Looks Like in Practice
- Why Monitoring-First Beats the Observability Hype Cycle
- Get Managed Monitoring and Observability Under One Contract
- Sources
Network Observability vs Monitoring: The Core Definitions
Monitoring is metric-based and threshold-driven. You define what "healthy" looks like, collect data against that baseline, and get an alert when a number crosses a line you set. It's the oldest and still most reliable layer of network operations, and it runs on a handful of well-worn protocols.
- SNMP polls device counters like CPU load, memory, and interface status at regular intervals.
- NetFlow and IPFIX capture flow-level traffic data, showing who talked to whom and how much bandwidth it consumed.
- Syslog streams event and error messages from routers, switches, and firewalls in near real time.
- Synthetic tests simulate user transactions, such as a scheduled ping or HTTP check, to catch outages before a real user does.
The KPIs that matter most are latency, packet loss, jitter, interface errors, bandwidth utilization, and device CPU or memory load. Monitoring is fast to deploy and cheap to run, and it catches the failures you anticipated. Its weakness is exactly that word: anticipated. Monitoring is inherently siloed, since each tool watches its own slice of the network, and it has no mechanism for catching a failure mode nobody wrote a rule for. According to AWS's comparison of the two disciplines, monitoring collects data on individual components and fires alerts on predefined conditions, which is exactly what makes it reliable for known problems and blind to new ones.
What Network Observability Actually Means
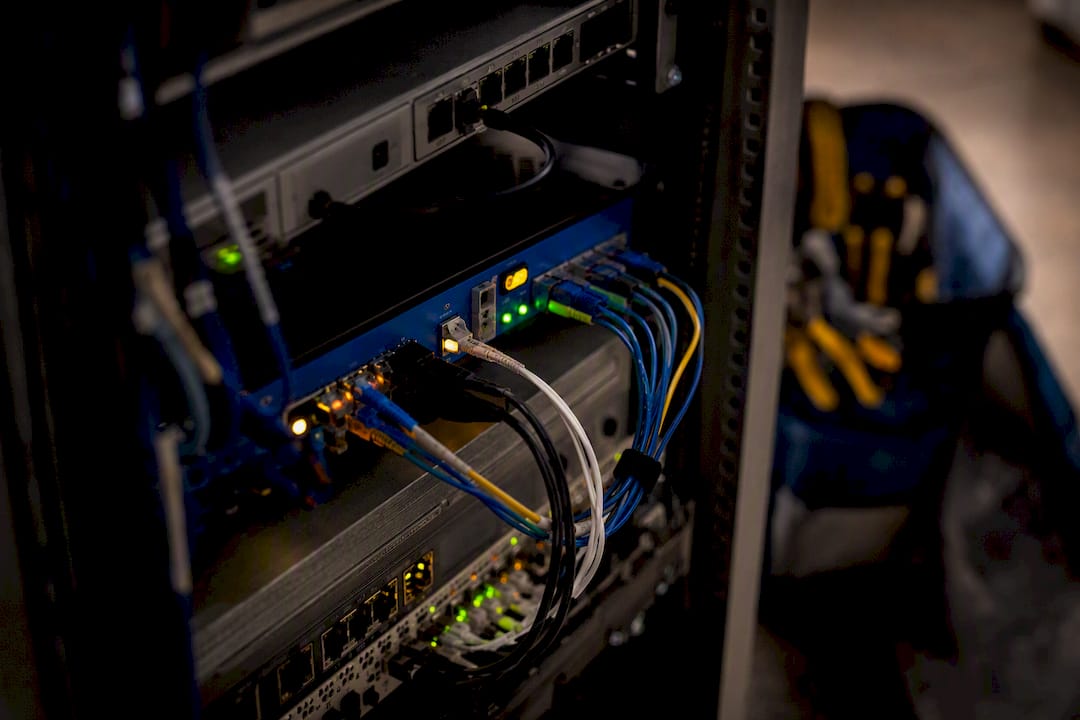
Observability is the capacity to answer a question you didn't know you'd need to ask, using nothing but the data your systems already emit. That's the definition IBM uses, and it's a useful one because it separates observability from any specific tool. It's a property of your telemetry, not a product you buy.
Where monitoring tells you a link is saturated, observability tells you which application is saturating it, which hop introduced the delay, and whether the same pattern happened last Tuesday during a firmware push. That's possible because observability platforms enrich raw telemetry with context: network topology, device configuration, and sometimes business metadata like which customer or transaction touched a given flow.
- Continuous path visibility across every hop between source and destination, not just spot checks at the endpoints.
- Automatic correlation that ties a spike in one metric to a log entry and a trace, without an engineer manually cross-referencing three tools.
- The ability to investigate incidents nobody anticipated, which Obkio's research on network observability identifies as the core capability separating it from monitoring.
The operational payoff is speed. Root-cause analysis that used to take a war room and four open terminal windows becomes a single query against correlated data.
Pro Tip: Don't buy a tool because it's labeled "observability" on the box. Test whether it actually shows every hop in the path, correlates telemetry automatically, and produces a usable root-cause artifact. Plenty of dashboards call themselves observability platforms and deliver neither.
Metrics, Logs, Traces, and the Network Telemetry You Need
The three pillars, metrics, logs, and traces, are the raw materials of both disciplines. Metrics are numeric time series: interface throughput, CPU load, error counts. Logs are discrete event records: a BGP session drop, a config change, an authentication failure. Traces follow a single transaction or packet flow across multiple hops or services, showing exactly where time was spent.
For networks specifically, that translates into a defined set of telemetry sources worth collecting:
- NetFlow/IPFIX and sFlow for flow-level visibility into traffic patterns and top talkers.
- Streaming telemetry (gNMI over gRPC) for near real-time device state, replacing slow SNMP polling cycles.
- Packet capture for deep forensic analysis when flow data isn't granular enough.
- Synthetic probes that continuously test path performance between sites, independent of real user traffic.
- Configuration and routing state snapshots that let you correlate a performance change with a change in the network itself.
Fidelity costs money. Full packet capture on every link generates enormous data volume, and most teams can't retain it for more than a few days without a serious storage budget. The practical approach is tiered: keep high-fidelity data for your most critical paths and shorter windows, sample or aggregate everything else, and enrich what you keep with topology and configuration context so a raw counter turns into an answerable question. Obkio's framework treats continuous telemetry, per-hop path visibility, and automated diagnostics as the three non-negotiables when evaluating any platform against this bar.
How Monitoring and Observability Actually Differ in Practice
The two disciplines split along four practical lines, and understanding each one changes how you build your toolchain.
- Scope. Monitoring watches individual devices or components. Observability treats the network as a single distributed system and looks at how components interact end to end.
- Reactivity. Monitoring is rules based: you set a threshold, it fires an alert. Observability supports exploratory investigation, letting an engineer ask an open-ended question about an incident after the fact, not just react to a predefined trigger.
- Data density. Monitoring often samples periodically, which is fine for trend lines but can miss a transient spike that happened between polls. Observability leans on continuous or near-continuous collection, which catches the intermittent problems that periodic sampling misses entirely.
- Correlation and context. This is where mean time to resolution actually drops. Monitoring gives you five separate alerts from five separate tools during an incident. Observability gives you one correlated view showing that all five alerts trace back to a single misconfigured route. IBM's comparison frames this correlation and enrichment layer as the actual differentiator, since the underlying telemetry types are often identical.
None of this makes monitoring obsolete. It makes it the layer observability depends on. You can't correlate data you never collected.
When to Use Each One, and How to Run Both Together
Small, single-site networks with predictable traffic patterns rarely need a full observability stack. A solid monitoring setup with sensible thresholds and a competent on-call rotation handles most of what comes up.
Observability earns its cost once specific signals show up:
- Recurring incidents with no clear root cause. If your team keeps closing tickets with "resolved itself" or "unclear," that's a correlation gap, not a bad-luck streak.
- A distributed or multi-site architecture. Once traffic crosses multiple carriers, sites, or cloud on ramps, monitoring's device-by-device view stops being enough.
- Mean time to resolution keeps climbing. If war rooms are getting longer instead of shorter, the bottleneck is almost always manual correlation across too many tools.
The staging path that works best in practice: get monitoring solid first, covering every critical device and link with sane thresholds. Then layer continuous telemetry, flow data, streaming device state, synthetic probes, onto your highest-value paths. Expand observability coverage from there, rather than trying to instrument everything on day one. This also means NetOps and any SRE function need a shared view of the data. Observability projects stall when the network team owns the telemetry and the operations team owns the incident response, with nothing connecting the two.
Building an Observability Rollout Without Breaking Your Budget
A rollout that actually sticks follows a predictable sequence.
- Map critical journeys first. Identify the transactions and paths where downtime actually hurts the business, and set SLOs against them before you instrument anything.
- Choose your instrumentation model. Decide between lightweight agents and streaming telemetry protocols like gNMI, and standardize tags and device identifiers before deployment, not after.
- Set storage and retention policy up front. Tier your data: short, high-fidelity retention on critical paths, aggregated or sampled data everywhere else.
- Design dashboards for investigation, not decoration. A dashboard that only shows a green checkmark is a vanity metric. Build drilldowns that let an engineer go from symptom to cause in a few clicks, an approach covered in more detail in this guide to centralized logs and real-time visibility.
- Write alert logic and playbooks together. Every alert should map to a documented response, and every observability query result should feed directly into that playbook.
Pro Tip: Standardize your tagging scheme before you turn on telemetry collection, not after. Retrofitting consistent site, device, and application tags onto six months of historical data is a project nobody enjoys.
The Pitfalls That Undermine Observability Projects
Alert fatigue is the most common failure mode, and it usually comes from treating every threshold breach as equally urgent. The fix is de-noising: group related alerts, tie thresholds to SLOs instead of arbitrary round numbers, and suppress duplicates during known maintenance windows. TechTarget's reporting on the practitioner side of this shift notes that unifying fragmented data streams directly addresses monitoring fatigue, since engineers stop chasing five alerts that all point to the same root cause.
- Telemetry volume grows faster than budgets expect. Set sampling and retention tiers before storage costs force an emergency cut.
- Missing topology or configuration metadata creates blind spots even when raw telemetry volume looks healthy.
- RCA without runbooks just produces faster confusion. Pair observability queries with documented escalation paths, a gap covered in this breakdown of turning alert noise into priority incidents.
What a Managed Observability Approach Looks Like in Practice
The Netverge platform pulls that fragmented carrier and device data into one dashboard instead of leaving IT directors to reconcile five vendor portals during an outage.
Vendor fragmentation is the quiet tax on every multi-location IT budget. A single dashboard with one engineer's number behind it turns a three-vendor finger-pointing exercise into a root-cause conversation.
Details on specific customer outcomes are documented in California Telecom's case studies.
Why Monitoring-First Beats the Observability Hype Cycle
The observability vendor world has spent several years insisting monitoring is obsolete. It isn't, and treating it that way is the single most common mistake I see network teams make. Monitoring is the foundation observability sits on top of, not a discipline it replaces. Skip a solid monitoring layer and you're left with rich, correlated telemetry describing a network you never properly instrumented in the first place.
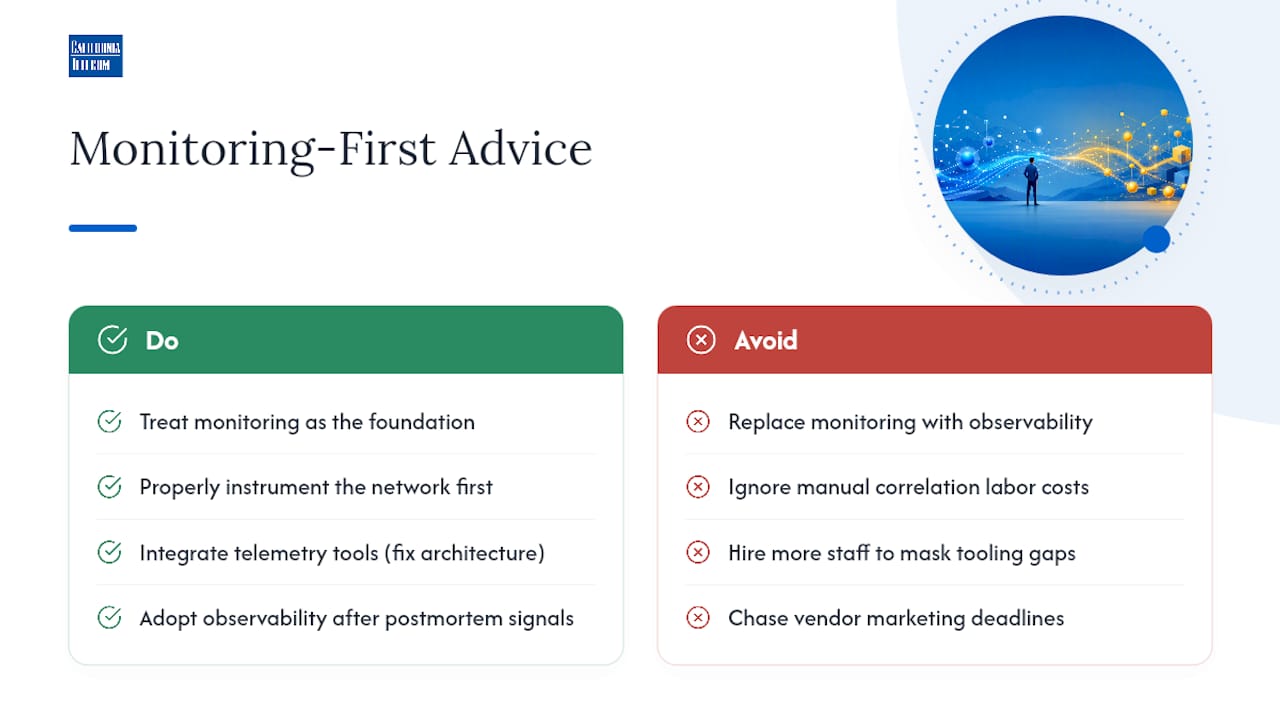
What actually gets underestimated is the labor cost of manual correlation. Teams will spend a full year tolerating three-hour war rooms before admitting the problem isn't headcount, it's five disconnected tools that nobody built to talk to each other. That's a telemetry architecture problem, not a staffing problem, and no amount of hiring fixes it.
My advice: don't chase observability because a vendor says it's the future; instead, consider insights from Agent-swarm to improve collaboration and monitoring integration. Chase it when your incident postmortems keep ending in "root cause unclear." That's the actual signal, not a marketing deadline. Get monitoring right first. Then add the correlated layer once you can name the specific blind spot it's supposed to close.
— Jim
Get Managed Monitoring and Observability Under One Contract
If you've read this far, you already know the real cost of network problems isn't the outage itself, it's the hours spent chasing which vendor, which hop, or which device caused it.Instead of stitching together SNMP polling, a separate flow analyzer, and a carrier portal for each site, you get Netverge's correlated telemetry across every location on a single dashboard, sourced from more than 50 carriers so you're never locked into one provider's blind spots. For multi-location IT teams tired of managing that complexity themselves, California Telecom's nationwide managed network services page outlines how the setup works site by site. Request a consultation to see what a unified monitoring and observability contract looks like for your network.
Sources
- Observability vs. Monitoring: What's the Difference? — IBM
- Network observability vs monitoring: What's the difference? — TechTarget
- Network Monitoring vs. Network Observability: What Do You Need? — Obkio
- W3C Trace Context
- What's the Difference Between Observability and Monitoring? — AWS