
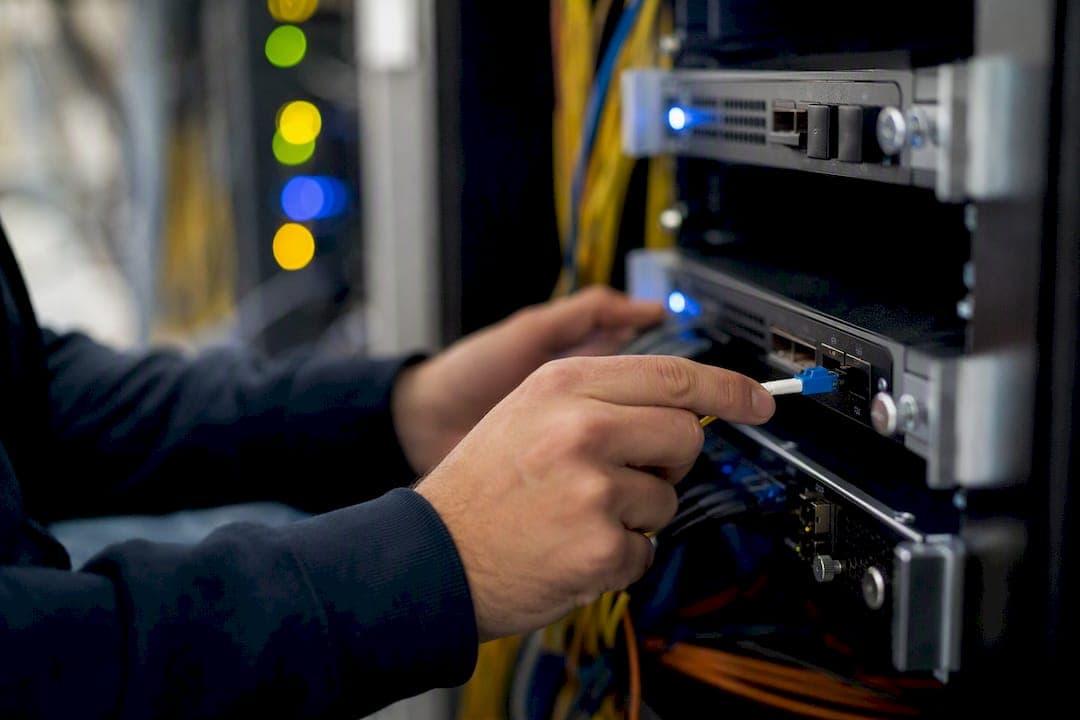
Network Failure: A Practical Fix Guide for IT ProsA network failure is any disruption that stops packets or services from reaching their intended endpoint, whether that's a single flapping interface or a full site blackout. The first move isn't diagnosis. It's containment.
Run this in the first five minutes:
- Isolate scope. Is it one device, one site, or everything downstream of a core switch or WAN edge?
- Confirm failover. Did the backup circuit or SD-WAN path actually take over, or is it sitting idle too?
- Notify owners. Tell business-critical system owners before they start opening tickets.
Prioritize traffic that keeps revenue and safety systems running (payment processing, EHR access, 911/E911 voice) ahead of general internet access.
Pro Tip: Run a synthetic probe against your ISP's gateway and check BGP session state before you touch a single switch. Half of "network down" tickets are actually upstream provider issues, and that one check saves you from chasing ghosts on your own gear.
Key Takeaways
Reducing network failure impact comes down to fast scope isolation, tested redundancy, disciplined change control, and monitoring built on historical baselines rather than static thresholds.
| Point | Details |
|---|---|
| Triage before diagnosing | Isolate scope, confirm failover actually activated, and notify system owners in the first five minutes. |
| Configuration errors lead causes | Change and configuration mistakes cause more outages than hardware failure in most enterprise environments. |
| Untested redundancy is unreliable | Schedule failover drills and chaos tests; a backup path only works if you've proven it works. |
| Correlate alerts, don't chase them | Sync logs to NTP and sort by timestamp to find the first failure in a cascade, not the loudest one. |
| Managed NOC fills coverage gaps | Californiatelecom's 24/7 U.S.-based NOC and carrier diversity supplement in-house teams facing alert fatigue or multi-site complexity. |
Table of Contents
- What Counts as a Network Failure?
- What Causes Most Network Failures?
- How Much Does Network Downtime Actually Cost?
- What Should You Monitor to Catch Failures Early?
- How Do You Troubleshoot a Network Failure Step by Step?
- Which Failures Get Misdiagnosed Most Often?
- What Redundancy and Failover Strategies Actually Work?
- What Operational Habits Prevent Repeat Failures?
- How Should You Structure a Post-Incident Review?
- When Should You Bring in Managed Network Services?
- An Operator's View on What Actually Reduces Downtime
- A Managed NOC Option for Teams Stretched Thin
- Frequently Asked Questions
- Sources
What Counts as a Network Failure?
Not every slow ticket is a "network failure," and knowing the taxonomy keeps you from chasing the wrong layer.
- Device failure: a switch, router, or access point stops forwarding traffic. Field sign: unreachable management IP, no link lights.
- Link failure: a physical or logical circuit drops. Field sign: interface down, CRC errors climbing before the drop.
- Routing/control-plane failure: BGP or OSPF loses adjacency. Field sign: traffic black-holes even though links are up.
- Service/application failure: the network is fine, but the app server or database is not. Field sign: pings succeed, app times out.
- DNS/DHCP failure: name resolution or address assignment breaks. Field sign: users get "site not found" errors network-wide.
Transient failures self-resolve in seconds; persistent ones need a human. If the network layer tests clean but the app doesn't respond, it's not a network incident, it's an application one, and you should hand it off fast rather than burning your own MTTR clock on it.
What Causes Most Network Failures?
Configuration and change errors top the list in most enterprise environments, alongside ISP outages, hardware failures, and congestion. A widely cited operations breakdown of enterprise failures points to ISP outages, routing misconfigurations, switch loops, broadcast storms, WAN congestion, packet loss, policy conflicts, and firmware drift as the recurring offenders, and that list matches what most NOC teams see week to week.
Here's the ranked breakdown with the fastest first check for each:
- Configuration/change errors: symptom is a sudden outage right after a maintenance window; first check is
show rundiff against the last known-good backup. - ISP/provider outage: symptom is total loss on one circuit only; first check is calling the carrier's status line and checking BGP peer state.
- Hardware/optics failure: symptom is a flapping link or degraded throughput; first check is
show interfacefor CRC errors and optical power levels. - Power/environmental issues: symptom is a full rack going dark; first check is UPS status and rack temperature logs.
- Congestion/packet loss: symptom is slow apps, not full outage; first check is interface utilization and queue drop counters.
- Firmware/software bugs: symptom is a device crashing after weeks of stable uptime; first check is the vendor's bug database against your running version.
- Routing/BGP issues: symptom is asymmetric or missing routes; first check is
show ip bgp summaryfor flapping neighbors. - Switch loops/broadcast storms: symptom is the whole LAN grinding to a halt; first check is spanning-tree topology change counters.
- DNS/DHCP failures: symptom is intermittent "can't reach anything" reports; first check is DNS query response time and DHCP scope utilization.
- Security incidents: symptom is unusual traffic spikes or device lockouts; first check is firewall logs for anomalous connection volume.
Physical-layer problems deserve special mention because they're easy to overlook: dirty fiber connectors, degraded optics, and unmanaged switches plugged in under a desk cause a disproportionate share of intermittent, hard-to-reproduce failures, according to outage risk reporting from DPS Telecom. Human error and misconfiguration remain the highest-frequency causes overall, which is exactly why change control matters more than any single piece of redundant hardware.
How Much Does Network Downtime Actually Cost?
Downtime cost breaks into three buckets: lost direct revenue, idle labor, and remediation effort. A single-site retail outage during business hours might cost a few thousand dollars in lost transactions; a multi-site outage during a payroll run or claims-processing window can be far more expensive once you add idle staff hours and emergency vendor callouts.
- Direct revenue loss: transactions that don't happen while systems are down.
- Labor cost: staff sitting idle or working around the outage manually.
- Remediation cost: overtime, emergency shipping for hardware, vendor escalation fees.
Cost compilations show enterprise downtime can run into the hundreds of thousands of dollars per hour for large organizations, and thousands per hour even for small and mid-size businesses, with human error contributing to a large share of incidents.
Even brief outages now carry outsized business risk. As availability expectations climb, downtime damages productivity, transactions, and customer trust in ways that compound the longer an incident runs. This is also where SLA tiers matter: consumer-grade broadband typically carries no meaningful uptime guarantee, while dedicated fiber circuits come with contractual remedies and defined restoration windows, which changes how fast you can escalate and what you can actually claim back.
What Should You Monitor to Catch Failures Early?
Most outages announce themselves early if you're watching the right signals. Watch for:
- Latency and packet loss trends against a rolling baseline, not just a fixed threshold.
- Interface errors and CRC counts, which usually climb before a link fully drops.
- Device CPU and memory utilization, especially sustained spikes on core routers and firewalls.
- BGP flap counts and session resets.
- Flow anomalies in NetFlow, sFlow, or IPFIX exports, like a sudden spike in east-west traffic.
- DNS query latency, a leading indicator of resolver or upstream problems.
For tooling, SNMP polling covers device health, flow protocols (NetFlow/sFlow/IPFIX) cover traffic patterns, and synthetic probes validate that a service path actually works end to end, not just that a device responds to ping. Packet capture stays your ground truth when metrics disagree with user reports.
Alert design matters as much as the data itself. Set thresholds against historical baselines rather than arbitrary round numbers, and build correlation rules so a core switch failure doesn't generate 200 child alerts from every downstream device. Teams that build alert correlation and synthetic monitoring into daily operations tend to catch degradations while they're still minor, rather than after users start calling.
Pro Tip: Run synthetic transactions against your most business-critical app path every 60 seconds, not just an ICMP ping to the gateway. Pings tell you the network is up. Synthetic probes tell you the service actually works, and slow creep in response time will show up there long before anyone opens a ticket.
How Do You Troubleshoot a Network Failure Step by Step?
The goal is always the same: find the first failure in the chain, fast, without guessing.
- Define scope. One user, one site, or everything? Check your monitoring dashboard before touching a CLI.
- Replicate the problem. Confirm it's reproducible and not a one-off blip.
- Check recent changes. Pull the change log for the last 24 hours. Most incidents trace back to something that changed recently.
- Test layer by layer. Physical (link lights, cabling) → link (interface stats, errors) → network (routing tables,
traceroute) → transport (port reachability) → application (service response). - Escalate with data, not guesses, once you've isolated the layer.
Quick commands worth keeping in your muscle memory: ping and traceroute for reachability and path, nslookup/dig for DNS resolution, show interface and show logging for device-level health, and tcpdump or tshark when you need to see what's actually on the wire. Reach for packet capture once metrics contradict what users are reporting.
Cascading failures hide the real root cause behind a wall of noise. Sync all your device logs to NTP and sort alerts by exact timestamp. The device or link that failed first is almost always the actual cause; everything after it is a symptom. A methodical workflow built on historical baselines and flow data turns "the network is slow" into a specific, testable hypothesis instead of a guessing game.
Pro Tip: Keep 30 days of flow data and synthetic test history on hand. When something breaks, comparing today's traffic pattern against last week's baseline narrows your search window from "the whole network" to "this one link" in minutes instead of hours.
Which Failures Get Misdiagnosed Most Often?
A quick-reference matrix saves time when three tickets land at once.
- Intermittent connection drops → often a failing optic or bad cable termination, not a software bug. First check: interface error counters.
- High latency on one specific app → usually congestion or a misconfigured QoS policy, not a "network is down" event. First check: interface utilization during the affected window.
- One-directional traffic loss → classic sign of a duplex mismatch or asymmetric routing. First check:
show interfaceduplex settings on both ends. - DNS resolution failures across the site → often a resolver or upstream forwarder issue, not a full outage. First check: DNS response time from multiple internal hosts.
- Total site blackout → power, core device failure, or upstream ISP loss. First check: UPS status, then carrier circuit status.
The most commonly misdiagnosed scenario is congestion mistaken for an ISP outage: users report "the internet is down" when really one bandwidth-heavy application has saturated a shared circuit. Checking interface utilization before calling the carrier saves an embarrassing amount of wasted escalation time.
What Redundancy and Failover Strategies Actually Work?
Redundancy only pays off if it's built and tested correctly, not just installed and forgotten.
- Dual-WAN with automatic failover: two circuits, one primary, one standby, switching on health-check failure.
- Active-active circuits: both links carry traffic simultaneously, improving both resilience and throughput.
- BGP-based multi-homing: multiple upstream providers advertised via BGP for carrier-level redundancy.
- SD-WAN overlays with application-aware steering that route voice and critical apps around a degraded path in real time.
- Cellular/LTE/5G failover for last-mile resilience when wired circuits are the single point of failure.
Tuning matters more than the pattern you pick. Set health-check targets carefully: too aggressive and you get flapping between paths on jitter alone; too conservative and users sit on a broken circuit far longer than necessary. Hard link failures on well-tuned SD-WAN deployments typically produce 1 to 10-plus seconds of traffic loss, while soft degradations can take minutes to detect unless enhanced application-aware routing is configured. Properly tuned dual-ISP setups generally land failover in the 10 to 90 second range, though near-zero interruption needs session-persistent enterprise SD-WAN, not just a backup circuit sitting idle.
Test it before you trust it:
- Schedule quarterly failover drills, not just a one-time cutover test at install.
- Run chaos-style tests: pull a cable, kill a BGP session, simulate a soft degradation.
- Measure and log actual reconvergence time against your target, and refine health-check thresholds based on results.
Pro Tip: Never use the same underlying carrier for primary and backup circuits. A single fiber cut or provider outage will take down both "redundant" paths at once, and that mistake shows up in field reports more often than you'd expect. A practical rollout plan for dual-ISP failover walks through carrier diversity in more depth.
What Operational Habits Prevent Repeat Failures?
Prevention is mostly discipline, not new hardware.
- Configuration management: keep versioned configs with automated nightly backups, and run a pre-flight check before every change window.
- Change control: schedule rollouts during low-impact windows, stage changes as canaries on non-critical devices first, and always have a tested rollback path ready before you push.
- Firmware discipline: track your device inventory against vendor advisories, stage upgrades on a test group, and stick to defined patch windows instead of ad hoc updates.
- Runbooks: write a specific playbook for your five most common incident types, and run tabletop exercises quarterly so the team isn't improvising during a real outage.
None of this eliminates failures entirely. It shrinks both how often they happen and how long each one takes to resolve, which is the metric that actually matters to the business. Good enterprise network design bakes a lot of this discipline into the architecture itself rather than leaving it to operational habit alone.
How Should You Structure a Post-Incident Review?
Every significant outage deserves a short, structured writeup, not a Slack thread that dies after a day.
- Timeline: when it started, when it was detected, when it was resolved.
- Detected vs. actual scope: what monitoring caught versus what actually happened.
- Root cause and contributing factors: the first failure plus anything that made it worse or harder to catch.
- Remediation and owners: specific fixes, assigned to specific people, with dates.
- Verification: how you confirmed the fix actually works in production, not just in theory.
Prioritize architectural fixes over quick patches when the same failure type recurs more than once. Track MTTR over a rolling quarter. If it's not trending down after your runbook updates, the runbooks need revising, not the team.
When Should You Bring in Managed Network Services?
A few signals suggest it's time to evaluate outside help: constant alert fatigue on a small team, the same outage type recurring despite fixes, multi-site complexity outgrowing your headcount, or SLA commitments you can't credibly back internally.
When you talk to providers, ask about their coverage model (true 24/7 or business-hours only), carrier diversity, onshore NOC hours, escalation SLAs, and how their monitoring integrates with what you already run. A managed provider works best as a supplement to your internal team on the incidents you don't have bandwidth to chase yourself, not a wholesale replacement for institutional knowledge.
An Operator's View on What Actually Reduces Downtime
Most of the redundancy investment in this industry gets spent on hardware and almost none of it gets spent on testing. That's backwards. A failover path nobody has tested since installation is a hope, not a plan, and scheduled drills plus synthetic validation are what actually separate resilient networks from ones that just look resilient on a diagram.
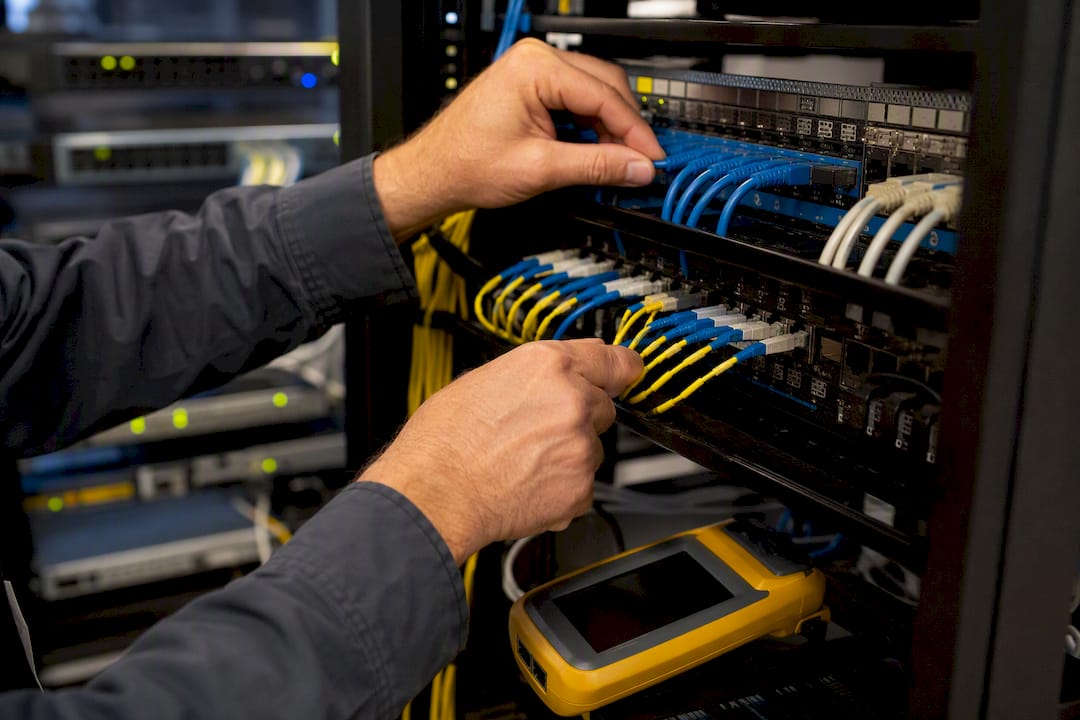
For a mid-market team running a handful of sites, a realistic MTTR target is somewhere in the 30 to 60 minute range for common failure types, not the near-instant recovery vendor marketing implies. Diagnosis approaches that treat root cause as an inference problem across dependency graphs and historical baselines consistently outperform manual guesswork, and that's true whether you're running that inference by hand or through tooling. Availability and agility pull against each other. The teams that manage both well are the ones that test their assumptions on a schedule, not just after something breaks.
A Managed NOC Option for Teams Stretched Thin
If your team is already stretched across change management, monitoring, and firefighting, adding 24/7 coverage in-house usually means new headcount you don't have budget for. Californiatelecom's managed network services fold multi-carrier redundancy, real-time monitoring, and a 24/7 U.S.-based NOC into one contract, backed by a 99.99% uptime SLA on data and 99.999% on voice, so you get one engineer's number to call instead of chasing five carriers during an outage.That single-point-of-contact model matters most during a cascading failure, when every minute spent figuring out which vendor owns the problem is a minute of downtime you didn't need. Californiatelecom sources from more than 50 carriers and designs each site's redundancy directly, which means failover paths get engineered and tested up front rather than bolted on after your first bad outage. If constant alert fatigue or repeat outages are wearing down your team, start with a consultation on managed network services to see where a 24/7 NOC would actually reduce your exposure.
Frequently Asked Questions
What is the most common cause of network failure? Configuration and change errors cause more outages than hardware failure in most enterprise environments, closely followed by ISP outages and physical-layer issues like degraded optics.
How do you tell a network failure from an application failure? Test the network layers first: if ping, traceroute, and interface stats all look clean but the app still doesn't respond, the problem sits at the application or database layer, not the network.
What's a reasonable MTTR for network failures? For mid-market teams with tested runbooks, 30 to 60 minutes is realistic for common failure types; complex cascading failures without good historical baselines take longer.
Can SD-WAN eliminate network failure entirely? No. SD-WAN reduces impact through automatic path steering, but hard link failures still cause brief traffic loss, and soft degradations can take minutes to detect without properly tuned application-aware routing.
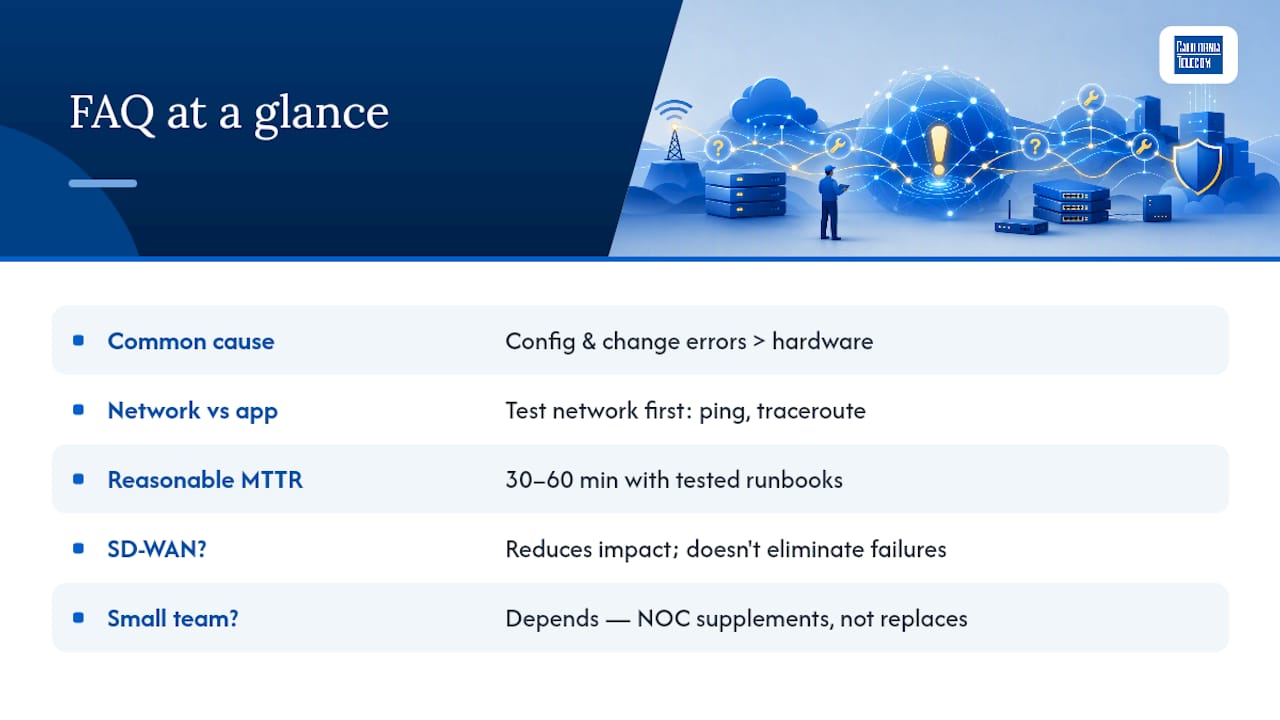
Should a small IT team handle network failures alone or use a managed NOC? It depends on alert volume and site count. A managed provider works best as a supplement covering off-hours and multi-site complexity, not a full replacement for institutional knowledge your team already has.
Sources
- Cost of downtime (EnterpriseDB blog)
- Incident
- Network troubleshooting guide for IT professionals (Paessler blog)
- NetMedic / detailed diagnosis (SIGCOMM CCR paper)
Recommended
- Bandwidth Issues: A Practical Troubleshooting Guide for IT Pros | California Telecom
- SD-WAN Failover: A Practical Runbook for Enterprise Networks | California Telecom
- Types of Business Continuity Network Solutions: 2026 Guide | California Telecom
- Dual ISP Failover: The Setup That Actually Keeps You Online | California Telecom