
Bandwidth Issues: A Practical Troubleshooting Guide for IT ProsIf internal iperf3 tests hit near-wire speed but external services crawl, the bottleneck is your WAN, ISP, or cloud edge. If iperf3 is slow inside the LAN, start at the device or physical layer. That single test splits most bandwidth issues into two completely different investigation paths.
First 5–15 minutes on an active incident:
- Confirm scope. Which users, sites, or applications are affected? Is it one VLAN, one building, or everywhere?
- Run two tests back to back. Internal:
iperf3 -c <LAN server> -P 8 -t 30. External:speedtest-cli --server <nearest>. Compare results. - Pull interface counters and device CPU. On the WAN-facing interface and any suspect switch uplinks, grab input/output rates, CRC errors, and discards. Check router/firewall CPU utilization.
What to capture before you escalate: the exact time window, the top three affected services, your iperf3 output (both directions), a snapshot of interface counters, and a 5-minute NetFlow or sFlow top-talker export. Without those, a carrier or managed-services team will spend the first hour asking for what you should have already collected.
Table of Contents
- How to tell bandwidth saturation apart from other problems
- A structured workflow for diagnosing bandwidth issues step by step
- Essential tools and exact commands to run right now
- Device and physical layer checks you should not skip
- When the bottleneck is the WAN, ISP, or cloud edge
- Quick mitigations you can apply now
- When to upgrade circuits, add redundancy, or deploy SD-WAN
- How to validate that your fix actually worked
- Quick-reference cheat sheet for on-call use
- When to call a managed provider: what Californiatelecom does
- How firewalls and IDS/IPS affect bandwidth and create bottlenecks
- Configuration pitfalls that cause bandwidth problems
- Key Takeaways
- The troubleshooting mistake most admins make
- Californiatelecom resolves bandwidth problems faster than you can chase carriers alone
- Useful sources and references
How to tell bandwidth saturation apart from other problems
Most slow-network complaints are not capacity problems. Device overloads and physical-layer faults — dirty optics, duplex mismatches, cable faults — are routinely mistaken for bandwidth shortages. The table below maps the most common symptoms to their likely cause and the first command to run.
| Symptom | Likely cause | First diagnostic command |
|---|---|---|
| Slow throughput, all users, all apps | WAN saturation or ISP throttling | iperf3 -c <internal> -P 8 then speedtest-cli |
| Intermittent drops, random timing | Physical layer: CRC errors, bad optics | show interfaces / ethtool -S eth0 |
| High latency, no packet loss | Device CPU or queue depth | show processes cpu / top on firewall |
| Packet loss at peak hours only | Saturation or microburst | NetFlow top-talker export, queue-depth counters |
| Loss on one hop in traceroute | Routing asymmetry or peering issue | mtr --report <destination> |
| One application slow, others fine | App-layer issue or QoS misconfiguration | Wireshark capture on affected flow |
| Asymmetric up/down speeds | ISP shaping or duplex mismatch | iperf3 -c <server> -R (reverse mode) |
Concrete clues that point away from raw capacity: rising CRC or FCS error counts on an interface, a duplex mismatch showing up as late collisions, asymmetric traceroute paths (forward and return traffic taking different routes), or a firewall CPU pinned at 95% while interface utilization is only 40%. Any of those means adding bandwidth will accomplish nothing.
Pro Tip: Check interface error counters before you even think about ordering more capacity. A single dirty SFP or a half-duplex port can look exactly like a saturated link on a dashboard.
A structured workflow for diagnosing bandwidth issues step by step
Structured divide-and-conquer troubleshooting — baseline first, then isolate, then test hop-by-hop — finds root cause faster than any single end-to-end speed test. Follow this sequence on every incident.
-
Define scope (0–5 min). Identify affected users, sites, VLANs, and applications. Is the problem symmetric (upload and download both slow) or directional? One site or all sites?
-
Gather baseline and last-known-good (5–10 min). Pull the 24-hour utilization graph from your SNMP or flow collector. Compare current interface utilization to the same window yesterday and last week. A four-step check sequence starting with the physical layer and a 24-hour bandwidth report often finds root cause faster than jumping straight to configuration audits.
-
Isolate the segment (10–20 min). Run iperf3 between two internal hosts on the same switch. Then run it across the LAN core. Then run speedtest-cli or iperf3 to an external endpoint. The segment where throughput drops is your target.
-
Test hop-by-hop (20–45 min). Use
mtrortracerouteto identify where latency or loss appears. Baselines, hop-by-hop testing, and cross-layer correlation are required to isolate latency and packet-loss causes — single-tool diagnostics miss routing asymmetry and device saturation. -
Collect flow data (30–60 min). Export 5–15 minutes of NetFlow or sFlow during the problem window. Identify top talkers by IP, application, and protocol. This step frequently reveals a backup job, a rogue sync client, or Shadow IT consuming the link.
-
Apply a short-term mitigation (60–90 min). QoS policy, rate limit, or backup rescheduling. Document exactly what you changed and keep rollback steps written down before you touch anything.
-
Validate and monitor. Re-run iperf3 and check interface counters. Confirm user experience has improved. Monitor for at least 24–72 hours before closing the incident.
Timeline guidance: 0–15 minutes is triage and scope. 15–60 minutes is targeted testing. 1–4 hours is remediation or carrier escalation. If you have not identified root cause within 4 hours on a production outage, escalate to your carrier or managed-services provider with the evidence packet described in the BLUF above.
Essential tools and exact commands to run right now
Every tool below serves a specific diagnostic purpose. Picking the wrong one wastes time.
iperf3
The standard for controlled throughput testing. Run a server on one host (iperf3 -s) and a client on another. For realistic maximum throughput, use parallel streams:
iperf3 -c 192.168.1.10 -P 8 -t 30
Eight parallel streams (-P 8) saturates most paths better than a single stream, which TCP slow-start can throttle. For reverse testing (server-to-client direction):
iperf3 -c 192.168.1.10 -P 8 -t 30 -R
iperf3 is the preferred tool over speedtest-cli for controlled internal tests; run multiple parallel streams and longer durations to saturate the path when validating maximum throughput. For cloud interconnects like Azure ExpressRoute, AzureCT wraps iPerf and PSPing into PowerShell scripts that capture outputs to files for escalation and trend analysis.
mtr
Combines ping and traceroute into a continuous hop-by-hop view. Use it when you suspect loss or latency at a specific network segment:
mtr --report --report-cycles 60 8.8.8.8
A 60-cycle report gives you a statistically meaningful loss percentage per hop. Loss that appears at one hop and persists through all subsequent hops indicates a real problem at that device. Loss that appears at one hop but disappears at the next is usually ICMP rate-limiting on a transit router — not a real issue.
traceroute / tracert
Use for a quick path map when mtr is not available:
traceroute -n 8.8.8.8          # Linux
tracert 8.8.8.8                # Windows
The -n flag skips DNS resolution and speeds up the output. Asymmetric paths (forward and return routes differ) can cause latency spikes that look like bandwidth problems.
ping
Fast first check for latency and loss. Use extended counts for statistical validity:
ping -c 100 192.168.1.1        # Linux
ping -n 100 192.168.1.1        # Windows
High jitter (variable RTT) with low average latency often points to queue depth or microburst activity rather than raw capacity.
Wireshark / tcpdump
Use when you need packet-level visibility. tcpdump captures to a file for later analysis in Wireshark:
tcpdump -i eth0 -w capture.pcap host 192.168.1.50
In Wireshark, the Statistics > I/O Graphs view shows throughput over time. TCP retransmissions visible in the stream indicate packet loss, not just slow throughput.
NetFlow / sFlow / IPFIX
Flow exporters on routers and switches send per-flow records to a collector (ntopng, ManageEngine NetFlow Analyzer, Kentik, or similar). These records show source IP, destination IP, protocol, port, and bytes transferred per flow. Without this data, you cannot reliably identify top talkers or Shadow IT.
SNMP interface counters
Poll ifInOctets, ifOutOctets, ifInErrors, ifOutErrors, ifInDiscards, and ifOutDiscards via SNMP OIDs on every suspect interface. Most monitoring platforms do this automatically, but you can query manually:
snmpget -v2c -c public 192.168.1.1 IF-MIB::ifInErrors.2
speedtest-cli
Useful for a quick external reference, but treat results with skepticism. Speedtest servers are geographically distributed and may not reflect the path your production traffic takes. Use it to confirm gross ISP-level issues, not to validate internal network performance.
Pro Tip: On Windows iperf3 clients testing high-bandwidth cloud links, tune the TCP window size with -w 4M to avoid TCP window scaling from artificially capping your throughput results.
Device and physical layer checks you should not skip
Physical and device-layer problems account for a large share of apparent bandwidth issues. Checking interface error counters and device CPU before ordering more capacity is not optional — it is the step most admins skip and later regret.
Interface counter checklist:
- CRC errors / FCS errors: Indicate physical-layer corruption. Even a few per hour on a gigabit link is abnormal. Cause: bad cable, dirty SFP, or EMI.
- Alignment errors: Frames not ending on a byte boundary. Usually a physical or NIC driver issue.
- Late collisions: Almost always a duplex mismatch. One side is full-duplex, the other is half-duplex.
- Input/output discards: Frames dropped due to buffer overflow. High output discards on a WAN interface mean the egress queue is full — a capacity or QoS problem.
- Overruns: Receive buffer overflow. The CPU or NIC cannot process frames fast enough.
- Output queue drops: The interface output queue is full. This is the clearest signal of congestion at that specific interface.
Device-level checks:
- Router/firewall CPU: above 70% sustained during the problem window is a red flag.
- Connection/state table utilization on firewalls: a full state table causes new connections to fail or slow, which looks like bandwidth saturation.
- Memory utilization: low free memory on a router can cause process scheduling delays.
- Optical power levels: check Rx power on SFPs against the manufacturer's acceptable range. A degraded optical signal causes intermittent errors that look like random packet loss.
Pro Tip: Microbursts can overflow switch buffers and cause packet loss even when average utilization appears low. Standard 5-minute SNMP polling will never show them. Use queue-depth counters or high-frequency streaming telemetry (sub-second intervals) to catch bursts that last milliseconds but drop hundreds of packets.
When the bottleneck is the WAN, ISP, or cloud edge
Internal iperf3 tests hitting near-wire speed while external throughput is poor is the clearest signal that the problem is outside your network. Confirm it with direction-specific mtr tests and sustained WAN interface utilization data.
Checks that point to WAN or ISP:
- iperf3 between internal hosts: near-line-rate. iperf3 to an external endpoint: significantly lower.
- mtr showing consistent packet loss or latency increase at the first external hop (your ISP's edge router).
- WAN interface utilization at or above 80% during business hours on a sustained basis.
- Asymmetric throughput: download is fine, upload is throttled, or vice versa.
Escalation ticket payload to send your ISP or cloud provider:
- Exact timestamps of the degradation window (with timezone)
- mtr output (60-cycle report) to the ISP's first hop and to the affected destination
- iperf3 logs (both directions, 8 parallel streams, 30-second duration)
- WAN interface counter snapshot (utilization %, input/output errors, discards)
- Your QoS or traffic-shaping configuration, if any
- A 15-minute NetFlow top-talker export showing traffic breakdown during the incident
For Azure ExpressRoute or similar cloud interconnects, AzureCT and PSPing provide standardized, repeatable test outputs that cloud support teams can directly compare against their own telemetry.
Pro Tip: Ask your ISP for their interface utilization data on your handoff port during the incident window. Carriers have this data. If they show 30% utilization on their side while your interface shows 95%, the bottleneck is in your equipment or the local loop — not their backbone.
Quick mitigations you can apply now
Congestion does not always mean insufficient bandwidth. Burstiness, poor QoS, and device limits can create congestion at moderate utilization levels. These mitigations reduce user impact while you investigate root cause.
Safe to apply immediately (no maintenance window required):
- Class-based QoS for VoIP/video: Mark SIP and RTP traffic as DSCP EF (Expedited Forwarding). On most platforms this is a policy-map change that takes effect without a link reset.
- Rate-limit guest SSIDs: Cap guest Wi-Fi at 10–20 Mbps per client or per SSID. Guest traffic should never compete with production.
- Police bulk transfer traffic: Apply a traffic policer to backup, FTP, or large file-transfer flows. Shaping (queuing excess) is gentler than policing (dropping excess) — prefer shaping for internal traffic.
- Schedule backups off-hours: Move any job that runs during business hours to a midnight-to-5 AM window. This alone resolves a surprising number of morning slowdown complaints.
- Throttle guest or personal-device traffic: Use per-client rate limits on the wireless controller.
Requires a maintenance window:
- Full interface reconfiguration (speed/duplex changes on production uplinks)
- ACL changes that affect routing or firewall state
- VLAN restructuring or spanning-tree topology changes
- SD-WAN policy changes that affect failover behavior
Document every change before you make it. Write the rollback command before you execute the change. If a mitigation makes things worse, you need to revert in under 60 seconds on a live incident.
Shaping will reduce throughput for the affected traffic class — that is the point. Make sure the class you are shaping is actually the problem, not a critical business application you have misidentified.
When to upgrade circuits, add redundancy, or deploy SD-WAN
Configuration changes and QoS fixes have a ceiling. When you hit it, the answer is architecture. The decision point is not complicated, but it requires honest utilization data.
Decision checklist:
- Repeated peak saturation after QoS and traffic-shaping mitigations are in place
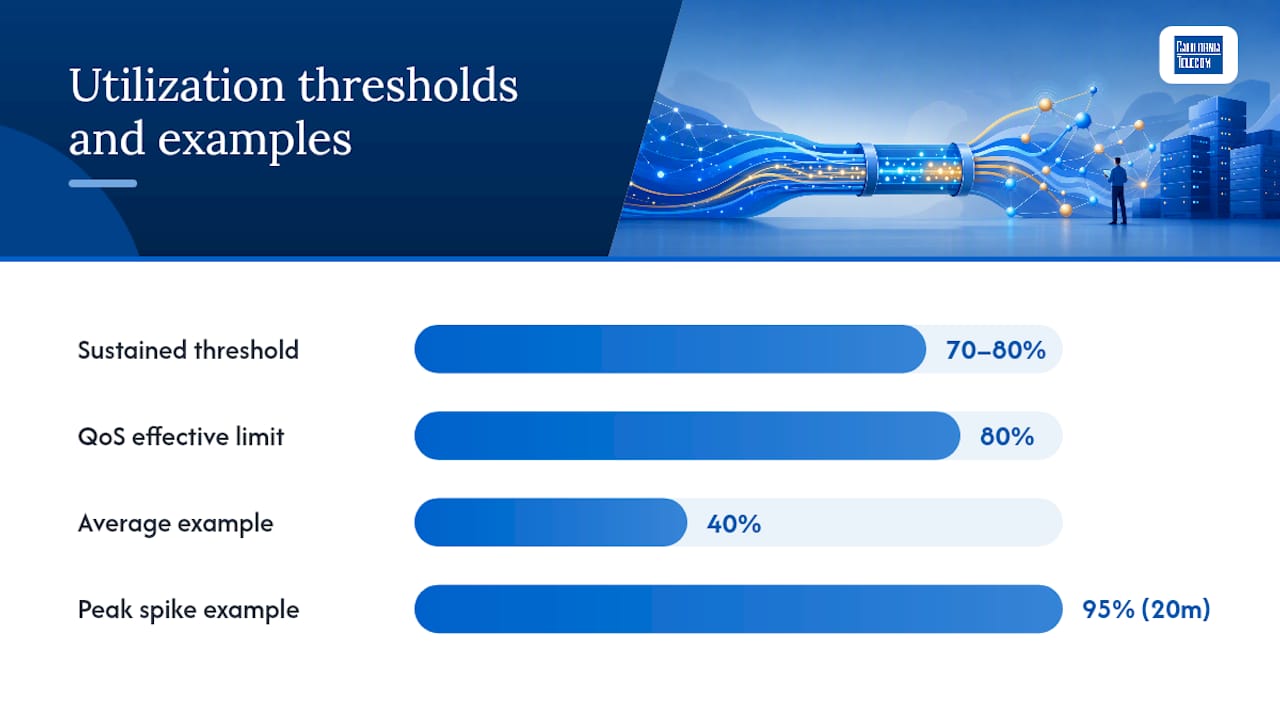
- Sustained WAN utilization above 70–80% during business hours on most weekdays
- Business growth projections that will add users, sites, or bandwidth-heavy applications within 12 months
- Critical application SLAs (voice MOS, video conferencing quality, EHR response times) that cannot be met with current capacity
Pro Tip: Capacity planning for multi-location businesses requires peak utilization data, not averages. A link that averages 40% utilization but spikes to 95% for 20 minutes every morning needs a capacity or QoS fix, not a "wait and see."
Options and rough timelines:
- QoS / traffic shaping only: Days to implement. Effective when the link is under 80% peak utilization.
- Bandwidth upgrade on existing circuit: Typically several weeks for a carrier provisioning change, depending on circuit type and provider.
- SD-WAN with multiple carriers: Several weeks for design, procurement, and deployment across sites. Adds redundancy, policy-based routing, and carrier diversity. Bandwidth aggregation across multiple carriers can provide both added capacity and failover without a single large circuit.
- Dedicated fiber: 60–120 days for new fiber provisioning. Symmetric speeds and an SLA-backed circuit are worth it for latency-sensitive workloads. Dedicated fiber consistently outperforms broadband for business-critical applications where uptime and symmetric throughput matter.
Before procurement, answer three questions: What is your peak vs. sustained utilization? What are the SLA requirements for your most critical applications? What is your acceptable failover time (RTO) if the primary circuit fails?
How to validate that your fix actually worked
A fix is not a fix until you have data proving it. Re-run the same tests you ran during the incident and compare results directly.
Post-fix checklist:
- Re-run iperf3 (same parameters:
-P 8 -t 30, both directions) and compare throughput to the incident baseline. - Capture a new 15-minute flow sample and confirm the top-talker profile has changed.
- Pull interface counters and verify error counts are not climbing.
- Check device CPU and memory on routers and firewalls.
- For voice and video, measure MOS scores or use a tool like PingPlotter to capture jitter and loss over a 30-minute window.
KPIs to record after every remediation:
- Sustained throughput (Mbps) at peak hours
- Packet loss percentage (target: below 0.1% for most applications; below 0.01% for VoIP)
- 95th-percentile latency on the WAN path
- User-reported incident count during the next peak period
How long to monitor:
- Quick fixes (QoS policy, rate limit, backup rescheduling): monitor for 24–72 hours through at least two peak periods.
- Architecture changes (circuit upgrade, SD-WAN deployment): validate over 1–4 weeks across multiple peak cycles before closing the change record.
Pro Tip: Set a temporary alert threshold at 60% WAN utilization for the first two weeks after a fix. If you hit it again quickly, the root cause was capacity, not configuration, and you need to revisit the upgrade decision.
Quick-reference cheat sheet for on-call use
Copy-paste commands and a compact checklist for use during an active incident.
Triage checklist:
- Confirm scope: affected users, sites, applications, and direction (upload/download/both)
- Check interface utilization and error counters on WAN and uplink interfaces
- Run internal iperf3 (LAN-to-LAN) and external speedtest-cli
- Pull 5-minute NetFlow top-talker report
- Check device CPU and firewall state-table utilization
Copy-paste commands:
# iperf3 server (run on a LAN host)
iperf3 -s

# iperf3 client — 8 parallel streams, 30 seconds
iperf3 -c 192.168.1.10 -P 8 -t 30

# iperf3 reverse (test download from server perspective)
iperf3 -c 192.168.1.10 -P 8 -t 30 -R

# mtr 60-cycle report
mtr --report --report-cycles 60 8.8.8.8

# traceroute (Linux / Windows)
traceroute -n 8.8.8.8
tracert 8.8.8.8

# ping with 100 packets
ping -c 100 8.8.8.8

# speedtest-cli
speedtest-cli --simple

# tcpdump capture to file
tcpdump -i eth0 -w /tmp/capture.pcap -c 10000

# SNMP interface error query
snmpget -v2c -c public <router-IP> IF-MIB::ifInErrors.2
snmpget -v2c -c public <router-IP> IF-MIB::ifOutDiscards.2
Escalation ticket template:
Incident start: [YYYY-MM-DD HH:MM TZ]. Affected services: [list]. Internal iperf3 result: [X Mbps / Y Mbps]. External speedtest result: [X Mbps / Y Mbps]. WAN interface utilization at peak: [X%]. Interface errors/discards: [values]. mtr output attached (60-cycle report to [destination]). Top-talker flow export attached (15-minute window). QoS/shaping config: [attached or none]. Requested action: [investigate WAN handoff / confirm no provider-side event].
When to call a managed provider: what Californiatelecom does
Some bandwidth problems are self-service. Others signal that the network architecture needs professional attention.
Engage Californiatelecom when:
- Peak saturation keeps recurring after QoS and traffic-shaping mitigations are in place
- You need multi-site failover planning and do not have carrier diversity today
- Device performance limits (firewall CPU, state-table exhaustion) require hardware replacement decisions
- You need 24/7 NOC-managed escalation to carriers without building that capability internally
- A circuit upgrade or SD-WAN deployment is on the table and you need carrier-agnostic sourcing across 50+ providers
What the managed engagement delivers:
Californiatelecom's managed LAN/WAN services cover the full stack: multi-carrier SD-WAN, dedicated fiber, wireless backup, carrier aggregation, and 24/7 U.S.-based NOC support. The Vergepoint platform provides single-dashboard observability with sub-minute telemetry, which is the resolution needed to catch microbursts that 5-minute SNMP polling misses entirely.
For multi-location businesses, the nationwide managed network model means one provider, one bill, and one engineer's direct number instead of coordinating between three carriers and two integrators during an outage.
Typical engagement timeline:
- Immediate (0–72 hours): NOC triage, short-term mitigation applied, carrier liaison opened if needed.
- 30 days: Root-cause analysis complete, architecture recommendation delivered.
- 60–90 days: Circuit upgrades, SD-WAN deployment, or QoS policy standardization across sites completed.
Pro Tip: When you first engage a managed provider, bring your iperf3 baseline data, interface counter history, and a 24-hour flow export. That evidence cuts the discovery phase from weeks to days.
How firewalls and IDS/IPS affect bandwidth and create bottlenecks
Security appliances are a frequently overlooked source of apparent bandwidth issues. A firewall or IDS/IPS sitting inline on a 1 Gbps circuit may have a rated throughput of 1 Gbps for basic packet forwarding, but that number drops sharply when deep packet inspection (DPI), SSL decryption, or intrusion prevention signatures are enabled.
SSL/TLS inspection is the biggest offender. Decrypting, inspecting, and re-encrypting HTTPS traffic at line rate requires significant CPU. On many mid-range firewalls, enabling full SSL inspection cuts effective throughput by 50–70%. If your organization recently enabled SSL inspection or updated IPS signature sets and users immediately started reporting slow connections, that is your culprit.
IDS/IPS in inline (blocking) mode adds latency to every packet it inspects. At low traffic volumes this is imperceptible. At high volumes, or when signature databases are large, per-packet inspection time accumulates and shows up as increased latency across all flows, not just the ones triggering signatures.
Troubleshooting security-appliance bottlenecks:
- Check firewall CPU and session-table utilization during the problem window. A firewall at 90% CPU is not a bandwidth problem — it is a compute problem.
- Temporarily disable SSL inspection on a test VLAN and re-run iperf3. If throughput recovers, SSL inspection is the constraint.
- Review IPS policy: are all signature categories enabled, including low-risk ones? Tuning the IPS policy to inspect only high-risk categories reduces CPU load without meaningfully reducing security posture.
- Check for asymmetric routing through the firewall. If return traffic bypasses the firewall, stateful inspection will drop or delay packets.
- For managed IT environments, working with a managed IT services partner can help audit security policy configurations that inadvertently throttle production traffic.
Configuration pitfalls that cause bandwidth problems
Misconfigurations are responsible for a large share of slow-network complaints that get misdiagnosed as capacity issues.
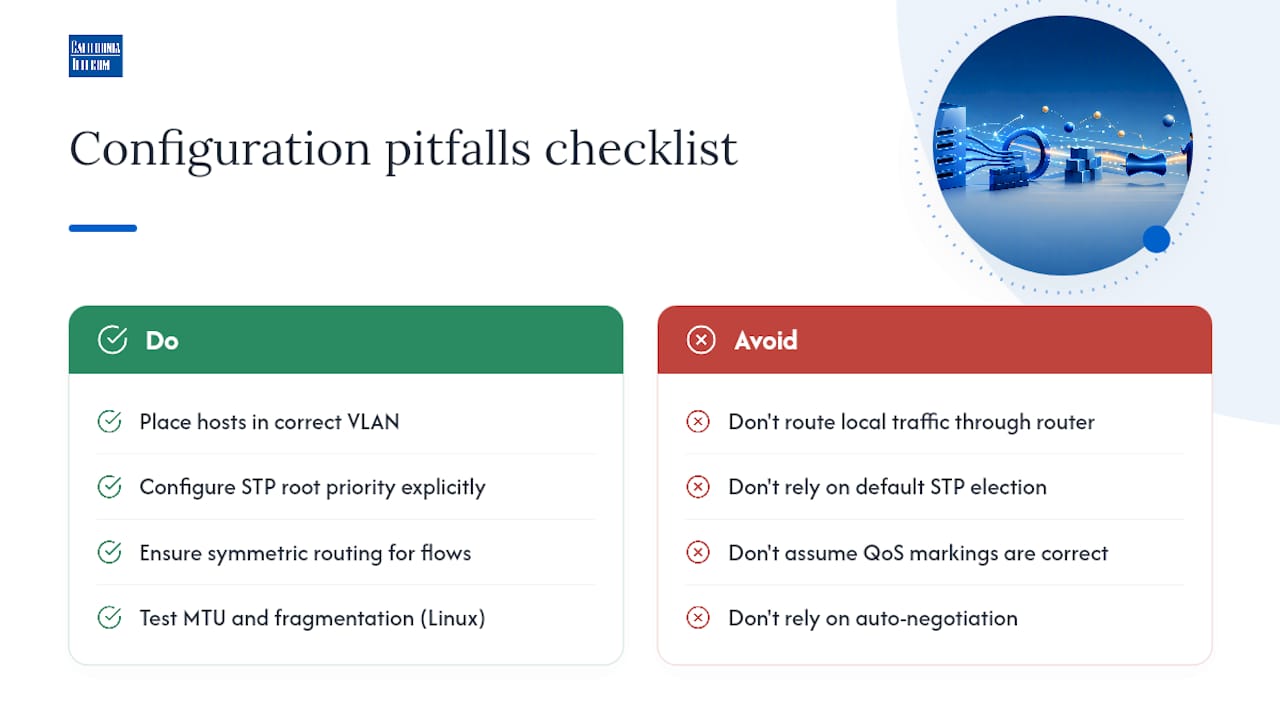
VLAN misconfiguration. A host placed in the wrong VLAN may route through a firewall or router for traffic that should stay on the local switch fabric. Inter-VLAN routing through a Layer 3 device adds latency and consumes CPU on the routing device. If a server that should be on the same VLAN as its clients is on a different VLAN, every transaction crosses a router hop unnecessarily.
Spanning Tree topology issues. A suboptimal Spanning Tree root bridge can force traffic across longer paths through the switch fabric. A root bridge elected by default (lowest MAC address) rather than by explicit priority configuration is a common source of unexpected latency between switches that are physically close.
Routing asymmetry. When forward and return paths for a flow traverse different devices, stateful firewalls drop packets because they only see half the session. This looks like random packet loss or connection resets, not a bandwidth problem, but it generates retransmissions that consume capacity.
MTU mismatches and fragmentation. A misconfigured MTU on a tunnel interface (GRE, IPsec, or SD-WAN overlay) causes fragmentation. Fragmented packets consume more CPU to reassemble, increase effective overhead, and can cause TCP throughput to collapse on paths that drop fragments. Test with ping -M do -s 1400 <destination> (Linux) to check for fragmentation.
Incorrect QoS marking. A QoS policy that marks backup traffic as high-priority, or that fails to mark VoIP traffic at all, can invert the intended priority scheme. Verify DSCP markings on actual traffic with a Wireshark capture rather than assuming the policy is working as configured.
Half-duplex negotiation. Auto-negotiation failures between a switch port and a NIC can result in one side operating at half-duplex. The result is late collisions and throughput that caps at roughly 40–50% of the link's rated speed. Always explicitly configure speed and duplex on server-facing and uplink ports rather than relying on auto-negotiation.
Key Takeaways
Diagnosing bandwidth issues correctly requires separating capacity problems from device, physical-layer, and configuration faults before making any changes.
| Point | Details |
|---|---|
| Test internally first | Run iperf3 between LAN hosts before testing externally; the comparison isolates whether the problem is inside or outside your network. |
| Check interface counters early | CRC errors, discards, and duplex mismatches often explain slow performance without any capacity upgrade needed. |
| Use flow data to find top talkers | NetFlow or sFlow exports reveal backup jobs, Shadow IT, and rogue sync clients that consume bandwidth invisibly. |
| Apply QoS before upgrading | Congestion at 60–80% utilization often resolves with class-based QoS and traffic shaping, not a circuit upgrade. |
| Californiatelecom for managed remediation | Californiatelecom provides 24/7 NOC-managed escalation, multi-carrier SD-WAN, and sub-minute telemetry for multi-location businesses that need ongoing visibility and carrier-agnostic sourcing. |
The troubleshooting mistake most admins make
The most common mistake on a bandwidth incident is skipping straight to "we need more bandwidth" before running a single interface counter check. It happens constantly, and it is expensive. A circuit upgrade takes weeks and costs real money. A dirty SFP takes five minutes to swap.
The second most common mistake is trusting 5-minute SNMP polling to tell the full story. It does not. A microburst that lasts 200 milliseconds and drops 2,000 packets will never show up on a 5-minute average utilization graph. The link looks fine. Users are complaining. Both things are true simultaneously. The only way to see microbursts is with sub-second telemetry or queue-depth counters, and most organizations do not have that instrumented until after they have already chased the problem for days.
Flow analysis is the third tool most admins underuse. Consider a scenario where a distribution company's WAN link saturates every morning at 8:45 AM. Interface counters look clean. iperf3 internal tests are fine. The culprit, revealed by a 15-minute NetFlow export, is a backup agent on a warehouse server that was reconfigured to run at 8:30 AM instead of midnight. No hardware problem, no ISP issue, no capacity shortage. A scheduler change fixed it in under 10 minutes. Without flow data, that incident could have taken days.
Californiatelecom resolves bandwidth problems faster than you can chase carriers alone
When bandwidth incidents keep recurring after you have applied QoS, rescheduled backups, and checked every interface counter, the problem is usually architectural, and that is where Californiatelecom's managed network services make a concrete difference.Californiatelecom sources circuits from 50+ carriers, designs and deploys each site through its own engineers, and backs every connection with a 99.99% uptime SLA on data. The Vergepoint platform delivers sub-minute telemetry and single-dashboard observability across all your locations, so microbursts and top-talker events are visible in real time, not discovered after the fact. For multi-location businesses, that means one provider managing carrier escalations, QoS policy, and hardware, instead of three separate vendors pointing fingers at each other during an outage.
The first 72 hours of a managed engagement typically deliver: NOC triage and short-term mitigation, a carrier liaison opened if the WAN is the bottleneck, and a documented root-cause analysis. The 30/60/90-day plan covers architecture remediation, circuit upgrades or SD-WAN deployment, and ongoing monitoring with SLA-backed support.
To get started, bring your iperf3 baseline, a 24-hour interface counter history, and a flow export from your last incident. Request a free consultation or review Californiatelecom's managed LAN/WAN solutions to see what a fully managed network engagement covers.
FAQ
How do you tell bandwidth saturation apart from other problems?
Most slow-network complaints are not capacity problems. Device overloads and physical-layer faults — dirty optics, duplex mismatches, cable faults — are routinely mistaken for bandwidth shortage. Check interface error counters and device CPU before ordering more capacity.
What is the right workflow for diagnosing bandwidth issues?
Structured divide-and-conquer: baseline first, then isolate, then test hop-by-hop. That sequence finds root cause faster than any single end-to-end speed test.
Which tools should you use to diagnose bandwidth problems?
iperf3 for controlled throughput testing between hosts, mtr for hop-by-hop loss and latency, extended ping counts for jitter, tcpdump and Wireshark for packet-level visibility, flow exporters (NetFlow/sFlow/IPFIX) for per-flow usage, and SNMP interface counters for errors and discards.
How do you know the bottleneck is your ISP or WAN rather than your network?
Internal iperf3 tests hitting near-wire speed while external throughput stays poor is the clearest signal the problem is outside your network. Confirm with direction-specific mtr tests and sustained WAN interface utilization data before opening a carrier ticket.
Useful sources and references
- Network troubleshooting
- Network fault management
- ExpressRoute troubleshooting network performance
- Troubleshooting Latency And Packet Loss In Large-Scale Networks – ITU Online IT Training
- What is network congestion? Causes, fixes & prevention | Domotz
- How To Fix Network Performance Issues
- Network bandwidth monitoring challenges
- Microburst detection | Kentik
- Troubleshooting slow enterprise networks — simple IT guide
Recommended
- What Is Bandwidth Aggregation? A Guide for IT Teams | California Telecom
- What Is Network Throughput? A Clear Technical Guide | California Telecom
- Why Dedicated Fiber Beats Broadband: Save Your Business from $9,000 Per Minute Downtime | California Telecom
- How to Improve Network Performance with Managed LAN/WAN Solutions | California Telecom