

MTTR vs MTBF: A Practical Guide for Engineering ManagersMTBF measures how often failures happen; MTTR measures how fast you recover from them. Both feed directly into the availability formula: Availability = MTBF / (MTBF + MTTR). If your primary risk is frequent outages, work on MTBF. If your primary risk is long recovery windows, attack MTTR first. For most IT and network operations teams, shortening MTTR yields faster availability gains than trying to eliminate failures outright, especially when failure frequency is low. Compute both metrics from your incident logs today, plug them into the formula, and test which improvement moves your availability number closer to your SLO target.
Availability = MTBF / (MTBF + MTTR) A system with MTBF = 720 hours and MTTR = 1 hour runs at 99.86% availability. Cut MTTR to 0.5 hours and availability climbs to 99.93%. Double MTBF to 1,440 hours instead, and you reach the same 99.93%. Both paths work; which one costs less depends on your failure modes.
Pro Tip: Before you optimize either metric, write down which MTTR variant you are tracking (repair, recovery, resolve, or respond) and which failure severities count toward MTBF. Changing those definitions mid-quarter is the fastest way to produce numbers that look great on a dashboard but mean nothing to your customers.
Key Takeaways
MTTR and MTBF together determine availability, but shortening MTTR almost always delivers faster reliability gains than increasing MTBF at typical IT operating points.
| Point | Details |
|---|---|
| MTBF measures failure frequency | MTBF = total operational time ÷ number of failures; higher is better. |
| MTTR measures recovery speed | MTTR (Recovery) = total downtime ÷ number of incidents; use the restore variant for SLO reporting. |
| Availability ties both together | Availability = MTBF / (MTBF + MTTR); test which improvement moves your number closer to your SLO target. |
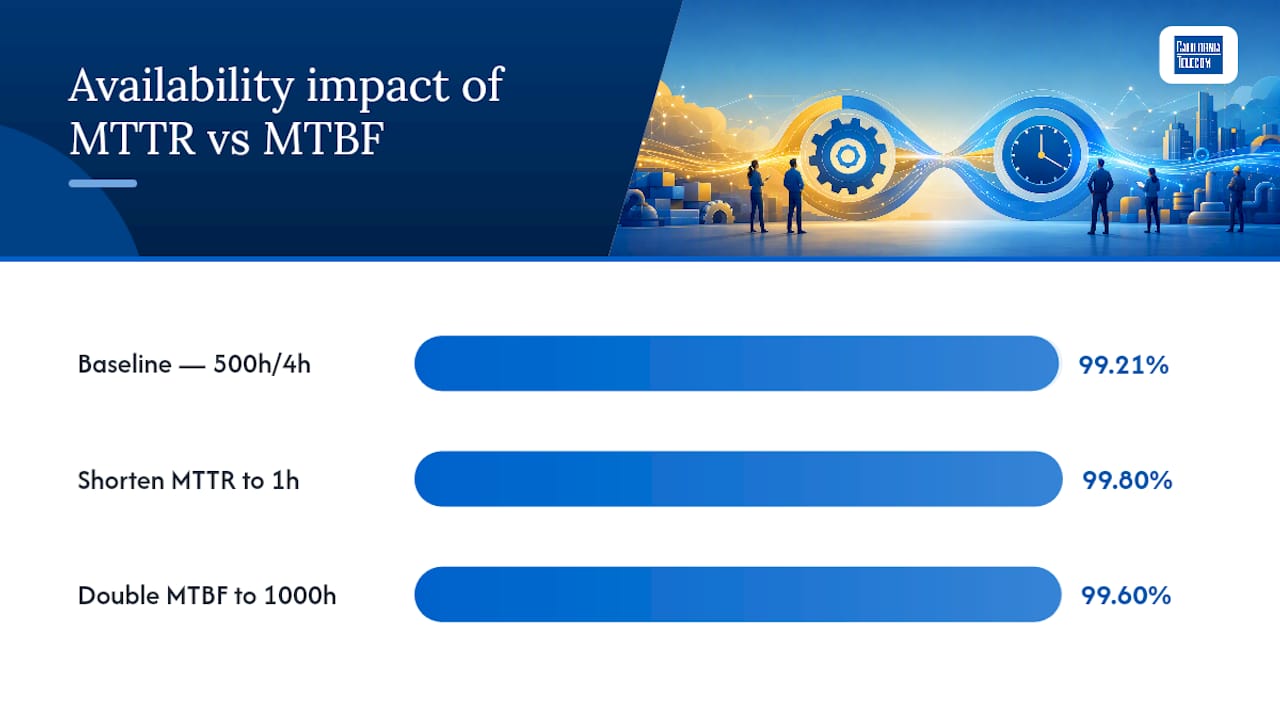
| Fix MTTR before MTBF | Shortening MTTR from 4 hours to 1 hour on a 500-hour MTBF system gains more availability than doubling MTBF. |
| Consistent definitions are non-negotiable | Changing MTTR variant or severity filters mid-quarter produces misleading improvements that do not reflect customer experience. |
Table of Contents
- What Is MTBF and How Do You Calculate It?
- What Is MTTR and Which Variant Should You Track?
- How Do MTTF, MTTA, and MTTD Fit Into the Picture?
- How MTBF and MTTR Combine to Drive Availability
- What Are Good MTTR and MTBF Benchmarks?
- How to Measure MTBF and MTTR Reliably
- How to Reduce MTTR and Increase MTBF
- Applying These Metrics to a Managed Network Service
- Why Engineering Managers Should Start With MTTR, Not MTBF
- Sources
What Is MTBF and How Do You Calculate It?
Mean Time Between Failures (MTBF) is the average operating time a repairable system runs between successive failures. It answers one question: how reliable is this system over time? A higher MTBF means failures happen less often. IBM defines MTBF as the average operational time between repairable failures, distinguishing it from MTTF, which applies to non-repairable components.
The MTBF formula
MTBF = Total Operational Time ÷ Number of Failures
Each term matters:
- Total operational time: clock hours the system was running and available, excluding planned maintenance windows.
- Number of failures: count of unplanned outages or degradations within the measurement period, filtered to the severity levels you care about.
Worked example
A network service runs for 30 days (720 hours). During that period, it experiences 4 unplanned outages. Planned maintenance accounts for 8 hours.
- Operational time: 720 − 8 = 712 hours
- MTBF = 712 ÷ 4 = 178 hours
That means, on average, the service fails once every 178 hours. Whether that is acceptable depends entirely on your SLO and the business cost of each failure.
When to use MTBF vs MTTF
MTBF applies to repairable systems: servers, network links, managed services. MTTF (Mean Time To Failure) applies to non-repairable components such as a hard drive or a fuse. For a hard drive, you measure MTTF because you replace it, not repair it. For a managed WAN circuit, you measure MTBF because the service is restored after each failure.
Use cases for MTBF:
- Preventive maintenance scheduling (trigger a maintenance cycle before the next predicted failure window)
- Reliability engineering and vendor qualification
- Warranty analysis and spare-parts planning
- SLA/SLO target-setting for service availability
Pro Tip: Filter MTBF by severity. If you include every Sev3 and Sev4 blip alongside Sev1 outages, your MTBF will look artificially low. Most ops teams track two MTBF figures: one for all incidents and one for Sev1/Sev2 only. The Sev1/Sev2 figure is what your SLA is actually measured against.
What Is MTTR and Which Variant Should You Track?
MTTR stands for Mean Time To Repair, but that single acronym covers four distinct measurements. Picking the wrong one, or letting different teams use different definitions, produces numbers that cannot be compared. Atlassian's incident metrics guidance is explicit: choose one variant, document it, and stick to it.
The four MTTR variants
- Mean Time To Repair: time from when repair work begins to when the fix is complete. Excludes detection and logistics delays. Useful for measuring technician efficiency.
- Mean Time To Recovery/Restore: time from when the failure occurs (or is detected) to when the service is fully restored. This is the most operationally useful variant for SLOs because it reflects actual customer impact.
- Mean Time To Resolve: time from incident open to full resolution, including root cause analysis and permanent fix. Longer than recovery; useful for problem management.
- Mean Time To Respond: time from alert firing to first human acknowledgment. A leading indicator of paging and on-call health.
The practical formula
MTTR = Total Downtime ÷ Number of Incidents
The start and end timestamps change by variant:
- Repair: start = repair work begins; end = system restored.
- Recovery/Restore: start = failure occurs (or first alert fires); end = service back to normal operation.
- Resolve: start = incident ticket opened; end = ticket closed with root cause documented.
- Respond: start = alert fires; end = on-call engineer acknowledges.
Worked example
Three incidents in a month. Recovery timestamps:
- Incident 1: 45 minutes of downtime
- Incident 2: 30 minutes of downtime
- Incident 3: 75 minutes of downtime
MTTR (Recovery) = (45 + 30 + 75) ÷ 3 = 50 minutes
If you had measured MTTR (Repair) instead and excluded the 10-minute detection delay on each incident, you would get (35 + 20 + 65) ÷ 3 = 40 minutes. Same incidents, different number. That 10-minute gap is exactly where detection improvements pay off.
Rules for consistent measurement
- Define start and end timestamps in writing before you start collecting data.
- Use automated timestamps from your monitoring system, not manual ticket entries.
- Exclude planned maintenance from both numerator and denominator.
- Agree on which severity levels count.
- Review the definition at least once per quarter to catch drift.
Pro Tip: For SLO reporting, the Recovery/Restore variant is almost always the right choice. It captures the full customer experience from failure to restoration, which is what your SLA is actually promising.
How Do MTTF, MTTA, and MTTD Fit Into the Picture?
MTBF and MTTR do not exist in isolation. Three related metrics fill in the gaps on either side of the recovery window, and each answers a different operational question.
MTTF (Mean Time To Failure) measures the expected lifetime of a non-repairable component before it fails permanently. As noted above, it applies to hardware you replace rather than repair. For reliability engineers, MTTF feeds into spare-parts inventory decisions and hardware refresh cycles.
MTTD (Mean Time To Detect) is the average time between a failure occurring and your monitoring system generating an alert. A long MTTD silently inflates your MTTR because customers are experiencing downtime while your system has not yet noticed. Reducing MTTD through synthetic checks, distributed probes, and lower polling intervals is often the cheapest way to cut total downtime.
MTTA (Mean Time To Acknowledge) measures the gap between an alert firing and an engineer claiming the incident. It reflects on-call health, escalation policy, and paging tool effectiveness. A high MTTA usually means your paging chain is broken or your on-call rotation is understaffed.
How they chain together
Total downtime for a single incident roughly equals:
MTTD + MTTA + (time to diagnose) + (time to repair) + (time to verify)
MTTR (Recovery) captures the whole chain from detection onward. Tracking MTTD and MTTA separately tells you where in that chain time is being lost.
When to add each metric to your reporting:
- Start with MTTR (Recovery). It maps directly to customer impact and SLO error budgets.
- Add MTTD when you suspect your monitoring is slow to fire or has coverage gaps.
- Add MTTA when MTTD looks healthy but incidents still take a long time to get moving.
- Add MTTF when hardware replacement cycles or component reliability are driving your MTBF numbers down.
How MTBF and MTTR Combine to Drive Availability
The availability formula is simple, but the sensitivity it reveals is not obvious until you run the numbers.
Availability = MTBF / (MTBF + MTTR)
The denominator represents the average total cycle time: one period of uptime plus one recovery. The numerator is just the uptime portion. Both metrics matter, but they do not contribute equally at every operating point.
Two worked examples
Example 1: High MTBF, long MTTR
- MTBF = 1,000 hours, MTTR = 10 hours
- Availability = 1,000 / (1,000 + 10) = 99.01%
Example 2: Low MTBF, low MTTR
- MTBF = 200 hours, MTTR = 1 hour
- Availability = 200 / (200 + 1) = 99.50%
Example 2 fails five times more often, yet delivers higher availability because recovery is fast. That is the core insight: a system that fails frequently but recovers in minutes can outperform a system that rarely fails but takes hours to restore.
Sensitivity note: When MTBF is large relative to MTTR, cutting MTTR in half roughly doubles the availability gain you would get from doubling MTBF. The math favors MTTR improvements at most realistic operating points for IT services.
What actually moves MTBF
- Release cadence and change frequency (more deployments = more failure opportunities)
- Component quality and redundancy
- Failure severity distribution (a Sev1 that takes the service down counts the same as a Sev1 that degrades one feature, unless you filter)
Sensitivity summary
- Shortening MTTR from 4 hours to 1 hour on a system with MTBF = 500 hours moves availability from 99.21% to 99.80%.
- Doubling MTBF from 500 to 1,000 hours on the same system (MTTR = 4 hours) moves availability from 99.21% to 99.60%.
- The MTTR improvement wins by 0.20 percentage points, and it is usually cheaper to achieve.
What Are Good MTTR and MTBF Benchmarks?
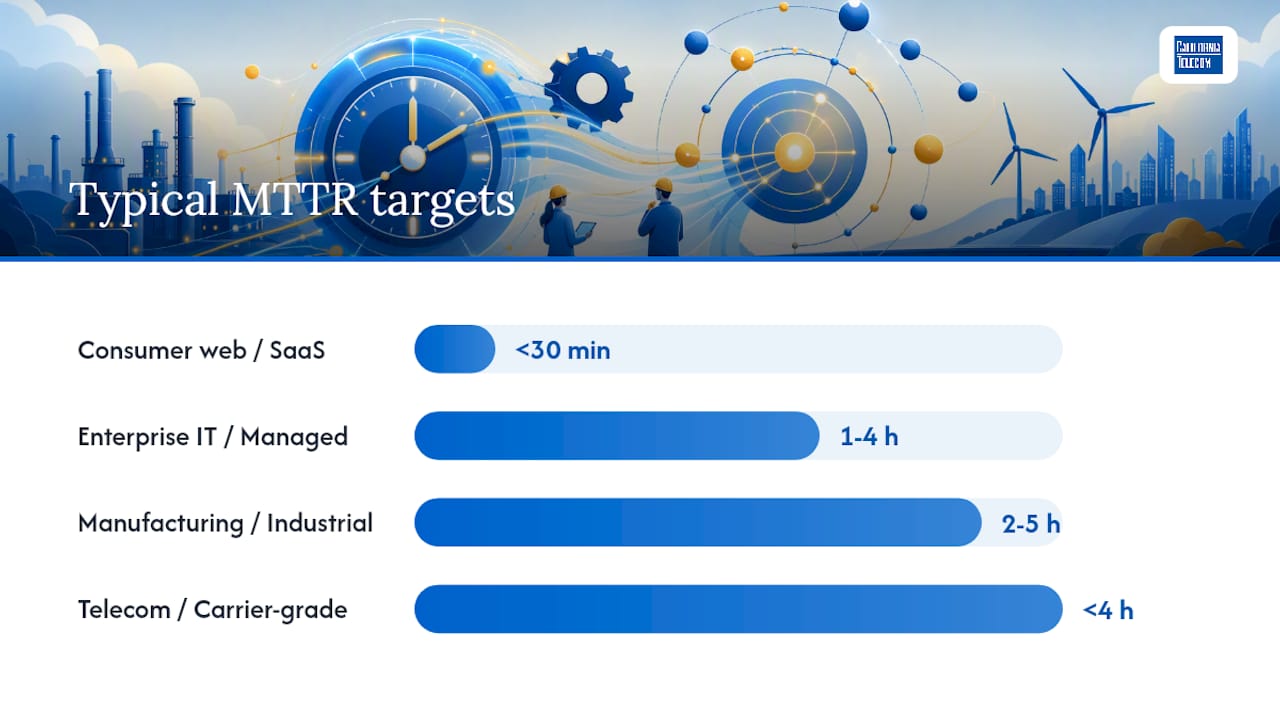
Benchmarks are context-dependent, but you need a starting point. ITIL guidance summarizes the general direction: MTTR should be as low as possible, with manufacturing teams often targeting under 5 hours and IT/security teams commonly targeting sub-hour MTTRs depending on severity and SLOs.
For severity-tiered targets, Cisco's remote management SLOs provide a concrete reference point: P1 incidents carry a 4-hour restore target, P2 a 12-hour target, P3 a 72-hour target, and P4 a 120-hour target. These are provider-side commitments, not aspirational goals, which makes them useful anchors when drafting your own SLAs.
Benchmark ranges by domain:
- Consumer web / SaaS: MTTR targets often under 30 minutes for P1; MTBF measured in weeks to months for core services.
- Enterprise IT / managed networks: P1 MTTR targets of 1–4 hours are common; MTBF goals of 500–2,000 hours for critical links.
- Manufacturing / industrial: MTTR targets of 2–5 hours for production equipment; MTBF goals of 1,000–10,000 hours depending on component criticality.
- Telecom / carrier-grade: MTTR targets under 4 hours for major outages; MTBF measured in years for core infrastructure.
Caveat: A benchmark from a different industry or a different severity filter is nearly useless as a direct comparison. A SaaS company's sub-30-minute MTTR for a P1 web outage is not the same measurement as a manufacturer's 4-hour MTTR for a production line stoppage. Always qualify benchmarks with the severity level, the measurement variant (repair vs. recovery), and the business context.
How to pick a target for your team:
- Start with your SLO error budget. If your SLO is 99.9% uptime (8.76 hours of allowed downtime per year), work backward: with your current MTBF, what MTTR keeps you inside that budget?
- Segment by severity. Set tighter targets for Sev1 and looser ones for Sev3/Sev4.
- Benchmark internally first. Your own trailing 90-day average is more actionable than an industry number from a different context.
How to Measure MTBF and MTTR Reliably
Good metrics start with good data. Most teams that produce unreliable MTTR/MTBF numbers have a data collection problem, not a calculation problem.
Minimal incident record schema
| Field | Purpose |
|---|---|
| Incident ID | Unique identifier for deduplication |
| Service / component | Scope of the failure |
| Failure start timestamp | When the failure occurred or first alert fired |
| Detection timestamp | When monitoring generated an alert |
| Acknowledgment timestamp | When an engineer claimed the incident |
| Repair start timestamp | When active remediation began |
| Service restored timestamp | When normal operation resumed |
| Ticket closed timestamp | When root cause was documented and ticket closed |
| Severity | Sev1–Sev4 or P1–P4 |
| Root cause category | Hardware, software, config, external, human error |
| Corrective action | What was done to restore and prevent recurrence |
Pro Tip: Automate timestamp capture wherever possible. Manual timestamps drift by 5–15 minutes in practice, which is enough to make a 30-minute MTTR look like 20 minutes on a good day and 45 minutes on a bad one.
Time-window choices
Rolling 30-day windows are useful for operational dashboards. Rolling 90-day windows smooth out anomalies and are better for SLO reporting. Annual windows are appropriate for capacity planning and vendor reviews. Avoid mixing windows across teams when comparing numbers.
Common pitfalls
- Inconsistent timestamps: mixing automated and manual entries in the same dataset.
- Silently closed incidents: tickets closed without a restoration timestamp because the engineer forgot to update them.
- Severity drift: Sev1 criteria loosening over time, inflating MTBF by reclassifying real outages as Sev2.
- Including planned maintenance: maintenance windows should be excluded from both MTBF operational time and MTTR downtime counts.
- Single-variant confusion: teams computing MTTR (Repair) and comparing it against a vendor's MTTR (Recovery) commitment.
Consistent metric definitions are non-negotiable for cross-team comparisons. Redefining MTTR midstream produces numbers that look like improvements but reflect nothing about actual customer experience.
For teams managing bandwidth-intensive environments, pairing incident data with bandwidth management practices helps isolate whether a degradation event qualifies as a failure for MTBF purposes or is a performance issue below the outage threshold.
How to Reduce MTTR and Increase MTBF
The two metrics call for different investments. ITU Online's reliability guidance frames it clearly: invest in MTBF improvements when failure costs are high; invest in MTTR improvements when downtime cost is the dominant business risk. Most IT and network operations teams should start with MTTR.
Actions that shorten MTTR
- Fix MTTD first. Deploy synthetic checks across all regions and critical paths. A failure your monitoring catches in 30 seconds costs far less than one it catches in 10 minutes.
- Automate the top three incident remediations. Identify your most frequent Sev1/Sev2 failure modes and build one-command or zero-touch remediation for each. Automated failover to a backup circuit is a common example for network services.
- Build runbooks for every top failure mode. A runbook that cuts diagnosis time from 20 minutes to 5 minutes is worth more than most hardware upgrades. Keep them in the incident tool, not a shared drive.
- Tighten your paging and escalation policy. High MTTA is usually a paging problem. Review escalation paths quarterly and test them with fire drills.
- Pre-position spare parts and pre-authorize remediation steps. For physical infrastructure, a spare router on-site cuts repair time from hours to minutes.
Actions that raise MTBF
- Add redundancy at failure-prone points. Dual WAN circuits, redundant power, and hardware failover all increase effective MTBF by ensuring a single component failure does not produce a service outage.
- Tighten change controls. Most Sev1 outages in IT environments are change-induced. A mandatory pre-deployment checklist and a tested rollback procedure reduce failure frequency directly.
- Run regular load and failure testing. Chaos engineering practices and scheduled load tests surface failure modes before customers do.
- Use preventive maintenance checklists to catch degrading components before they fail. Scheduled inspections on physical infrastructure extend component life and push MTBF higher.
- Diversify carrier and hardware sourcing. Single-vendor or single-carrier dependencies create correlated failure risk. Multi-carrier SD-WAN architectures reduce the probability that any one failure takes down the whole service.
Pro Tip: Sequence your investments. Shore up detection and paging first (cheapest, fastest ROI on MTTR). Then automate common fixes. Then invest in prevention for the failure modes with the highest business cost. Jumping straight to redundancy hardware before fixing a 15-minute MTTD is spending money in the wrong order.
For teams dealing with recurring connectivity problems, a structured bandwidth troubleshooting approach often reveals failure patterns that are driving MTBF down without appearing in incident tickets as formal outages.
Maintenance management software can automate preventive maintenance scheduling and failure tracking, which feeds directly into MTBF improvement programs by reducing unplanned failures before they occur.
Applying These Metrics to a Managed Network Service
A multi-site retail chain runs 20 locations on a managed WAN. Over 90 days, the network experiences 6 Sev1 outages across all sites combined. Total operational time across all sites is 20 sites × 2,160 hours = 43,200 site-hours. Planned maintenance accounts for 400 site-hours.
- MTBF = (43,200 − 400) ÷ 6 = 7,133 hours per failure
- Total downtime across all 6 incidents = 9 hours
- MTTR (Recovery) = 9 ÷ 6 = 1.5 hours
- Availability = 7,133 / (7,133 + 1.5) = 99.979%
Now suppose two of those incidents had a 4-hour recovery instead of 1.5 hours, pushing total downtime to 19 hours and MTTR to 3.17 hours. The MTBF did not change. The MTTR did.
Provider-side practices that move these numbers
Improving MTTR:
- 24/7 U.S.-based NOC with pre-authorized remediation steps (no approval chain delay during an outage)
- Automated failover to backup circuits before a human is even paged
- Spare hardware staged at or near customer sites
- Runbooks for the top 10 failure modes, updated quarterly
Improving MTBF:
- Sourcing from multiple carriers so a single carrier outage does not produce a site failure
- Redundant hardware at each site (dual routers, dual power)
- Proactive monitoring that catches degradation before it becomes an outage
- Controlled change management with tested rollback procedures
Californiatelecom's managed LAN/WAN services are built around exactly these practices: multi-carrier sourcing from 50+ providers, single-dashboard observability through Vergepoint hardware, and a 24/7 NOC that handles remediation without waiting for customer approval.
Supporting KPIs that belong alongside MTTR/MTBF in a NOC operations dashboard include MTTD, MTTA, automation rate, first-contact resolution, and SLA compliance rate. These give you a complete picture of where time is being lost across the incident lifecycle.
What to ask a managed network provider
- Report MTTR and MTBF separately by severity level, not as a blended average.
- Provide raw incident logs with machine-generated timestamps, not just summary reports.
- Specify which MTTR variant is used in SLA calculations (recovery/restore is the right answer).
- Show the availability formula and the MTBF and MTTR inputs behind any uptime percentage claim.
- Confirm whether planned maintenance is excluded from availability calculations.
Cisco's SLO framework provides a useful template: severity-tiered restore targets (P1 = 4 hours, P2 = 12 hours) give you a concrete baseline to negotiate from. Ask any provider to match or beat those targets in writing, and ask for the incident-level data to verify them.
For multi-location deployments, multi-site network management practices determine whether MTBF and MTTR are measured per-site or across the aggregate service, which changes the numbers significantly.
Why Engineering Managers Should Start With MTTR, Not MTBF
Most reliability roadmaps I see get the sequencing wrong. Teams spend months on redundancy projects and hardware upgrades trying to push MTBF higher, while their MTTD is 12 minutes and their on-call paging chain has a 20-minute gap in the middle of the night. That is the wrong order.
Start with MTTR because it maps directly to what customers experience and what your SLO error budget is actually consuming. A 2-hour outage burns the same error budget whether it happened because of a hardware failure or a software bug. MTBF tells you how often you are burning that budget; MTTR tells you how fast you are burning it each time.
My recommended action priority:
- Shore up detection and paging. Audit your synthetic check coverage and your escalation policy. Fix gaps before anything else.
- Automate common fixes and build runbooks. Pick the three failure modes that appear most often in your Sev1/Sev2 history and build one-command remediation for each.
- Invest in prevention for high-cost failure modes. Once MTTR is stable and your detection is solid, look at the failures that are still happening frequently and ask whether redundancy or better change controls would eliminate them.
One warning: metric gaming is a real risk. If your team knows MTTR is being measured, there is pressure to close incidents quickly, sometimes before the root cause is understood. Consistent definitions and a clear distinction between "service restored" and "incident resolved" are what keep the metric honest. Changing the definition to hit a target is worse than missing the target.
FAQ
What is the difference between MTTR and MTBF?
MTBF (Mean Time Between Failures) measures how reliable a system is — the average operating time between successive failures. MTTR (Mean Time To Repair/Recovery) measures how fast you restore it. Together they determine availability.
How do you calculate MTBF and MTTR?
MTBF = total operational time ÷ number of failures, excluding planned maintenance windows. MTTR = total downtime ÷ number of incidents. Define the start and end timestamps in writing before collecting data — different teams using different definitions produce numbers that can't be compared.
How do MTBF and MTTR combine into availability?
Availability = MTBF ÷ (MTBF + MTTR). The sensitivity surprises people: a system with MTBF 200 hours and MTTR 1 hour reaches 99.50% availability, beating a system with MTBF 1,000 hours and MTTR 10 hours at 99.01% — despite failing five times as often.
Should you improve MTTR or MTBF first?
MTTR, at typical IT operating points. Shortening MTTR from 4 hours to 1 hour on a system with 500-hour MTBF moves availability from 99.21% to 99.80%; doubling MTBF on the same system only reaches 99.60% — and recovery improvements are usually cheaper than reliability engineering.
Sources
- Common incident metrics — Atlassian
- Service Level Objectives — Remote Management Services | Cisco
- MTTR vs. MTBF: How to Reduce Failures and Maintenance KPIs - ITIL
Recommended
- Bandwidth Management for IT Teams: A Practical Playbook | California Telecom
- Multi-Site Network Management Explained for IT Leaders | California Telecom
- Bandwidth Issues: A Practical Troubleshooting Guide for IT Pros | California Telecom
- What is business-grade broadband for multi-location IT | California Telecom