
Bandwidth Management for IT Teams: A Practical PlaybookBandwidth management is the set of monitoring, prioritization, and enforcement practices that keep a network performing predictably under load. Get it right and your VoIP calls stay clear during backup windows, your ERP traffic never competes with a software update, and your SLAs hold. Get it wrong and you're chasing complaints with no data to explain why.
Start here, in this order:
- Establish a baseline. Collect at least two weeks of traffic data before touching any policy.
- Identify top talkers. Use NetFlow or sFlow to find which hosts, applications, and protocols are consuming the most bandwidth.
- Classify and mark traffic. Apply DSCP or 802.1p markings at the ingress edge so every downstream device honors the same intent.
- Apply QoS prioritization. Map traffic classes to queues with appropriate scheduling and bandwidth guarantees.
- Shape or police at enforcement points. Use traffic shaping on egress to smooth bursts; use policing where you need hard rate limits or on inbound interfaces.
- Schedule heavy jobs off-peak. Backups, patch distribution, and large file transfers belong outside business hours.
- Iterate with monitoring. Measure SLO breach rates, MOS scores, and queue drops weekly until the network stabilizes.
Californiatelecom operates this cycle daily across multi-location enterprise networks, backed by a 24/7 U.S.-based NOC and strong SLA commitments of high uptime on data and voice.
Key Takeaways
Effective bandwidth management requires measurement before policy, classification before queuing, and continuous monitoring before any capacity decision.
| Point | Details |
|---|---|
| Baseline before configuring | Collect two weeks of NetFlow/IPFIX data to identify peak patterns before writing any QoS policy. |
| Shape on egress, police on ingress | Shaping smooths bursts with buffering and is done on outbound (egress) interfaces; policing drops immediately and is the only practical option on inbound interfaces, as inbound traffic cannot be buffered before being received. |
| Police the priority queue | Always cap the LLQ/strict-priority class at 30–33% of link capacity to prevent voice traffic from starving other classes. |
| Use three-tier policies for multi-site | Match egress to carrier CIR, balance tunnels between sites, then apply application-level prioritization per site. |
| Californiatelecom for managed operations | Californiatelecom provides 24/7 NOC-monitored SD-WAN with 99.99% data and 99.999% voice SLAs for multi-location businesses. |
Table of Contents
- What does bandwidth management actually mean?
- Why bandwidth management matters for performance, cost, and SLAs
- How do classification, shaping, policing, and QoS actually work?
- Which scheduling algorithm fits your workload?
- How do RED, WRED, ECN, and buffer tuning reduce congestion?
- How do you measure who's using your bandwidth?
- How do you design bandwidth policies for multi-site networks?
- Implementation checklist: from baseline to full rollout
- Common causes of link performance problems and how to troubleshoot them
- Which tools should you use for monitoring and control?
- When should you apply controls vs. provision more capacity?
- Enterprise multi-site example and operational playbook
- What running bandwidth management at scale actually looks like
- How Californiatelecom handles bandwidth management for multi-site businesses
- Sources
What does bandwidth management actually mean?
Before any configuration makes sense, the vocabulary has to be precise. Misusing "bandwidth" and "throughput" interchangeably is how teams end up buying capacity they don't need.
Core units and concepts:
- Bandwidth is the maximum capacity of a link, measured in bits per second (bit/s). A 1 Gbps fiber port has 1 Gbps of bandwidth whether it carries one packet or a million.
- Throughput is the actual data rate delivered end-to-end, after accounting for overhead, retransmissions, and queuing delays. Throughput is always less than or equal to bandwidth.
- Utilization is throughput expressed as a percentage of capacity. A link running at 750 Mbps on a 1 Gbps port is at 75% utilization.
- Peak vs. average utilization tells different stories. A link that averages 40% but spikes to 95% for 10 minutes every morning has a real problem that averages hide.
- Upstream vs. downstream refers to traffic direction relative to the subscriber. Controls are almost always applied on egress (outbound from the device's perspective) because you can only shape what you're sending. Inbound policing exists but cannot buffer, so it drops.
Short-form QoS glossary:
- Classification: identifying a packet's traffic class by inspecting headers, DSCP bits, or application signatures.
- Marking: writing a DSCP (Layer 3) or PCP/CoS (Layer 2) value into the packet header so downstream devices honor the same class.
- Policing: enforcing a rate limit by dropping or re-marking packets that exceed it, immediately, with no buffering.
- Shaping: buffering excess packets in a queue and releasing them at a conforming rate, smoothing bursts rather than dropping them.
- Queuing: holding packets in one or more queues pending transmission.
- Scheduling: deciding which queue to service next and how many bytes to pull from each.
- CIR (Committed Information Rate): the guaranteed minimum rate a carrier or policy will deliver.
- Burst: a short-duration rate above the CIR that a policy may allow before policing or shaping kicks in.
- Token bucket / leaky bucket: the two canonical rate-enforcement models. Token bucket allows bursting up to a bucket size; leaky bucket outputs at a fixed rate regardless of arrival pattern.
Conceptually, picture an egress forwarding pipeline: packets arrive from the routing engine, get classified by ACL or NBAR, receive a DSCP mark, enter a class queue, and are scheduled for transmission by the interface scheduler. Shaping sits between the scheduler and the physical interface, holding packets when the output rate would exceed the configured profile. That sequence is where every mechanism in this article lives.
Why bandwidth management matters for performance, cost, and SLAs
The business case for controlling traffic isn't abstract. Every unmanaged link eventually hits a moment where the wrong traffic wins.
User experience and application health:
- Latency above 150ms one-way degrades VoIP call quality below a MOS of 3.5, the threshold where users reliably report poor audio.
- Jitter above 30ms causes packet reordering that disrupts real-time media even when average latency looks acceptable.
- Packet loss above 1% on a TCP connection triggers slow-start, cutting throughput by far more than the loss rate itself suggests.
- Failed transactions in retail POS or healthcare EHR systems during peak hours translate directly to revenue loss and compliance risk.
Cost control:
Overprovisioning is the most common response to performance complaints, and it's often the wrong one. Rescheduling heavy jobs to off-peak hours frequently costs nothing and resolves the problem. Targeted QoS policies can defer a capacity upgrade by months. That said, controls have limits: if a link runs above 80% utilization during business hours after optimization, provisioning more capacity is the right answer.
SLA and compliance:
Carrier SLAs define latency, jitter, and availability thresholds. Violating them triggers credits, but the operational damage, missed calls, failed backups, and degraded application performance, often costs more than the credit covers. Internal SLOs tied to application performance require the same discipline: you can't report against a threshold you haven't measured.
Use-case example: A 50-site retail chain runs nightly inventory sync over the same WAN links used for daytime POS traffic. Without shaping, the sync saturates the uplink at 11 PM and the morning shift opens to a link still recovering from TCP retransmissions. Scheduling the sync with a rate cap and moving it to 2 AM costs nothing and eliminates the morning complaints.
Establishing utilization baselines and SLOs is what makes this kind of decision data-driven rather than reactive. Two weeks of traffic data typically captures enough business-cycle variation to distinguish a structural capacity problem from a scheduling problem.
How do classification, shaping, policing, and QoS actually work?
QoS is the framework that ties classification, marking, policing, shaping, queuing, and scheduling into a coherent policy. Each mechanism has a specific job, and using the wrong one at the wrong point causes more problems than it solves.
Classification and marking
Classification happens at the ingress edge, ideally as close to the source as possible. NBAR2 on Cisco IOS-XE, for example, can identify applications by deep packet inspection without relying on port numbers alone. Once classified, packets receive a DSCP mark (EF for voice, AF41 for video conferencing, CS3 for call signaling, BE for bulk data) that every downstream device reads. Accurate classification is the foundation: a miscategorized backup stream in the EF queue will destroy voice quality faster than no QoS at all.
Shaping vs. policing
This is where most misconfigurations happen. Shaping buffers excess packets to smooth bursts and conform to a configured profile, typically on egress. Policing immediately drops or re-marks packets that exceed a rate limit, with no buffering. Shaping needs memory and a scheduler; policing does not, which is why policing is the only option on inbound interfaces.
When to use each:
- Shape on slow egress links where TCP retransmissions from drops would hurt more than the added latency from buffering.
- Police at ISP demarcation points to enforce contracted rates, and always police the strict-priority queue to prevent voice traffic from starving everything else.
- Police inbound when you need to enforce a rate on traffic arriving from a peer or customer, since you cannot shape what you haven't sent.
Enforcement points
The three main enforcement points are the customer edge egress (where you control shaping and queuing), the ISP demarcation (where the carrier polices to your contracted CIR), and WAN tunnel interfaces (where overlay policies apply). Inbound policing at the CE router is possible but blunt: it drops without smoothing, so use it only where hard rate enforcement is the goal.
Packet flow through the pipeline
A packet arrives, gets classified by NBAR or ACL, receives a DSCP mark, enters the appropriate class queue (EF, AF, BE), and waits for the scheduler to pull it. The scheduler applies the configured algorithm (LLQ, CBWFQ, WFQ) and releases packets to the interface. If a shaper sits between the scheduler and the physical interface, it holds packets when the output rate would exceed the configured profile.
Pro Tip: When enabling LLQ or any strict-priority queue, always pair the priority command with a police statement capping the priority class at a safe ceiling, typically 30–33% of link capacity for voice. Without that ceiling, a burst of video or a misconfigured softphone can starve your transactional traffic entirely. The QoS role in business voice guide covers this configuration pattern in detail.
Which scheduling algorithm fits your workload?
Scheduling determines which queue gets served next and how bandwidth is divided among competing classes. The right choice depends on the mix of latency-sensitive, transactional, and bulk traffic on a given link.
Algorithm descriptions:
- WFQ (Weighted Fair Queuing): automatically classifies flows and assigns weights based on IP precedence. Good default for links with mixed, unclassified traffic. Provides fairness but limited control over specific classes.
- CBWFQ (Class-Based WFQ): extends WFQ with explicit class definitions and minimum bandwidth guarantees per class. The standard choice for most enterprise egress policies.
- WRR (Weighted Round Robin): serves queues in proportion to configured weights, cycling through them. Simple and predictable, but doesn't account for packet size variation.
- DWRR (Deficit Weighted Round Robin): corrects WRR's packet-size bias by tracking a deficit counter per queue, ensuring byte-level fairness. Preferred over WRR on links with mixed packet sizes.
- HFSC (Hierarchical Fair Service Curve): supports both bandwidth and delay guarantees through a hierarchical class structure. Powerful but complex to configure; used where strict latency bounds are required alongside bandwidth sharing.
- LLQ (Low Latency Queuing): adds a strict-priority queue to CBWFQ. Voice and interactive video go into the priority queue and are served before all other classes. Must be policed to prevent starvation.
Workload-to-scheduler mapping:
| Workload type | Recommended scheduler | Key configuration knobs |
|---|---|---|
| VoIP / real-time audio | LLQ (priority queue) | Priority bandwidth ceiling (police to 30–33% of link); EF DSCP |
| Video conferencing | LLQ or CBWFQ AF41 class | Min bandwidth guarantee; jitter buffer at endpoint |
| Transactional (ERP, POS) | CBWFQ | Min bandwidth per class; AF4x DSCP |
| Interactive web / SaaS | CBWFQ or WFQ | Moderate weight; CS1 or AF11 |
| Bulk / backup / patching | CBWFQ lowest class or WFQ | Shaped rate cap; schedule off-peak; BE DSCP |
| Mixed / unclassified | WFQ (default) | IP precedence weights; upgrade to CBWFQ when classes are defined |
A note on interactions: shaping a class inside CBWFQ adds latency to that class but protects other classes from its bursts. Policing a priority queue is not optional; it's the mechanism that keeps LLQ from becoming a single-class link during a traffic spike.
How do RED, WRED, ECN, and buffer tuning reduce congestion?
Active queue management (AQM) is what separates a well-tuned network from one that swings between empty queues and tail-drop cliffs.
RED and WRED
Random Early Detection (RED) starts dropping packets probabilistically before a queue fills completely. This prevents the synchronized TCP slow-start that happens when a full queue drops packets from every flow simultaneously, a phenomenon called global synchronization. Weighted RED (WRED) extends this by applying different drop thresholds per DSCP class: high-priority traffic gets a higher minimum threshold (drops later) and a lower maximum drop probability.
Enable WRED on CBWFQ classes that carry TCP bulk traffic, as recommended by congestion management guidelines. Don't enable it on the LLQ priority queue, where drops should never be random, and don't enable it on UDP-only classes where TCP's congestion response doesn't apply.
ECN (Explicit Congestion Notification)
ECN lets a router mark packets as "congestion experienced" rather than dropping them, signaling the sender to slow down without the retransmission overhead. Both endpoints must support ECN as specified in RFC 3168, and it must be enabled on the router interface and in the OS TCP stack. Modern Linux kernels and Windows Server 2012 and later generally support ECN by default. On links where retransmissions are expensive, ECN combined with WRED is measurably better than tail-drop alone.
Buffer tuning and bufferbloat
Bigger buffers reduce drop rates but increase latency, sometimes dramatically. Bufferbloat occurs when a device holds hundreds of milliseconds of packets in a large queue, adding latency that makes real-time applications unusable even though the link isn't technically "congested." The fix is smaller, actively managed buffers combined with AQM.
Pro Tip: To spot bufferbloat, run a ping to a remote host while simultaneously saturating the link with a large file transfer. If round-trip time jumps from 10ms to 200ms or more during the transfer, you have bufferbloat. The fix is usually reducing the interface queue depth and enabling WRED or a CoDel-based AQM policy.
Troubleshooting notes: check show interfaces for output drops and input drops separately. Output drops on a congested egress queue are expected and manageable; input drops on an ingress interface usually indicate a hardware or driver issue, not a QoS problem.
How do you measure who's using your bandwidth?
Flow telemetry plus sampled packet captures give you the fastest path to root cause: flows show who and what, captures show why and how at the packet level. The top monitoring challenges include root-cause identification, granular visibility, voice/media traffic control, and threat detection — all of which flow and DPI tools address directly.
Measurement methods compared:
- NetFlow/IPFIX: router-generated flow records exported to a collector. Shows source/destination IP, port, protocol, byte counts, and timestamps. Low overhead, high coverage. The standard for top-talker analysis and capacity trending.
- sFlow: sampled packet headers exported from switches and routers. Provides near-real-time visibility at the cost of statistical sampling error. Better for high-speed links where full NetFlow export would overwhelm the CPU.
- SNMP polling: queries interface counters (ifInOctets, ifOutOctets, ifInErrors) at regular intervals. Fast to deploy, but shows only aggregate utilization, not per-flow or per-application breakdown.
- Packet capture (pcap): full packet inspection via Wireshark or tcpdump. Definitive for diagnosing specific flows, retransmissions, or application behavior. Not scalable for continuous monitoring.
Triage workflow:
- Start with SNMP to identify which interfaces are near saturation.
- Pull NetFlow or sFlow data to find the top-k talkers, top protocols, and busiest time windows on those interfaces.
- If a specific flow looks suspicious or a protocol is unexpectedly high, run a targeted packet capture on that interface and filter by source/destination.
- Correlate flow data with application logs to confirm whether the traffic is legitimate (a scheduled backup) or anomalous (an unauthorized transfer or a scanning tool).
Key metrics to track continuously:
- Interface utilization (peak and 95th percentile)
- Top-k talkers by bytes and flows
- RTT and packet loss per application class
- Jitter and MOS for voice traffic
- Queue drop rates per class
- SLO breach rates (how often a class exceeds its latency or loss threshold)
Must-feature tools:
- SolarWinds NetFlow Traffic Analyzer: collects and analyzes NetFlow, sFlow, and IPFIX data. Strong on top-talker reports, application-level breakdown, and historical trending. Integrates with SolarWinds NPM for combined flow and SNMP views.
- PRTG Network Monitor: sensor-based NMS that covers SNMP, NetFlow, packet sniffing, and application monitoring in one platform. Good for teams that want a single pane of glass without deploying separate collectors.
- ntopng: open-source flow and packet analytics with a web interface. Handles NetFlow/sFlow/IPFIX and supports DPI via nDPI for application-level classification. Strong choice for teams that want granular visibility without a commercial license.
- Wireshark: the definitive packet-level debugger. Use it for targeted captures when flow data points to a specific problem. Not a continuous monitoring tool, but irreplaceable for diagnosing TCP behavior, retransmissions, and application-layer issues.
Pro workflow: run a NetFlow query in SolarWinds or ntopng to identify the top five talkers on a saturated interface. Then open Wireshark on the router's SPAN port, filter by the offending source IP, and look for retransmission patterns or unexpected protocol behavior. That combination resolves most root-cause questions in under 30 minutes.
How do you design bandwidth policies for multi-site networks?
Multi-site network traffic control is where policy complexity compounds fast. A policy that works perfectly at headquarters can saturate a 50 Mbps branch link or create asymmetric behavior across SD-WAN tunnels if it isn't designed with the full topology in mind.
Architectural concepts:
- Per-site CIR: each site should have a defined committed information rate that matches its carrier contract. Policies must shape to that CIR, not to a theoretical maximum.
- Central policy plane: SD-WAN controllers push consistent policy templates to all sites, ensuring DSCP markings and class definitions are uniform. Local telemetry-driven overrides handle site-specific exceptions without breaking the global template.
- Local breakout: direct internet access at the branch for SaaS traffic (Microsoft 365, Salesforce) reduces backhaul and keeps latency low. QoS policies for local breakout must be defined separately from backhauled traffic.
- Overlay vs. underlay: QoS markings in the overlay (SD-WAN tunnel) may not be honored by the underlay carrier. Verify DSCP preservation end-to-end, or use the SD-WAN controller's own traffic engineering to enforce priorities within the overlay.
Three-tier policy approach
Large multi-site environments commonly use a three-tier bandwidth policy: first, match egress to carrier committed rates; second, balance tunnels between sites; third, apply application-level prioritization per site. This structure keeps carrier billing predictable, prevents tunnel imbalance from creating hot spots, and ensures application priorities are enforced where they matter most.
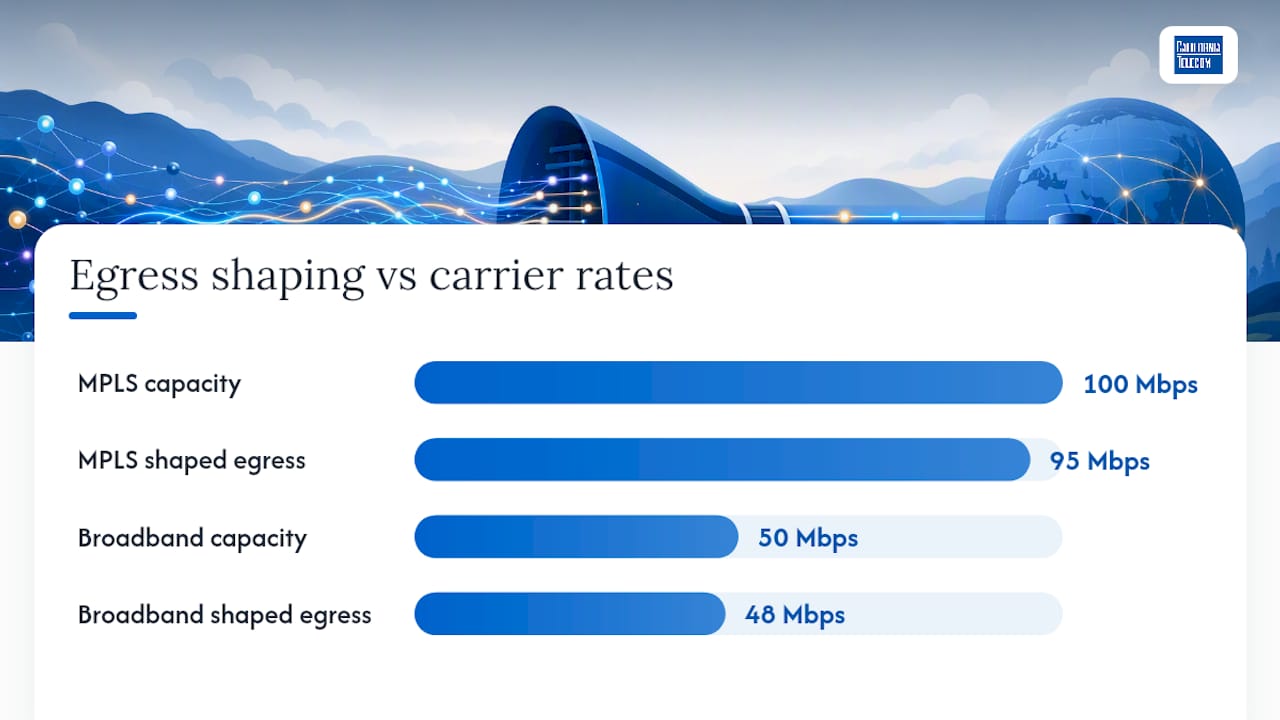
A short example: a 20-site retail network with 100 Mbps MPLS and 50 Mbps broadband per site uses the SD-WAN controller to shape all egress to 95 Mbps on MPLS and 48 Mbps on broadband (leaving headroom for carrier policing). Tunnel balancing distributes POS and ERP traffic across both paths. Application policies then prioritize POS traffic above ERP, ERP above general web, and push backup traffic to the broadband path during business hours.
Operational monitoring for multi-site:
- Monitor per-site utilization centrally, not just aggregate WAN utilization.
- Alert on per-site queue drop rates, not just interface utilization.
- Track SLO breach rates per application class per site, so a problem at one location doesn't hide in aggregate metrics.
- For multi-carrier aggregation, verify that failover policies correctly reclassify traffic when a primary path fails, and that QoS policies apply correctly on the backup path.
For a deeper look at how SD-WAN transforms multi-site connectivity at the architectural level, the design patterns around controller-based policy enforcement are worth reviewing before building your first policy template.
Implementation checklist: from baseline to full rollout
The biggest implementation mistake is skipping straight to policy configuration without data. Collecting baseline data, mapping topology, and verifying improvements with monitoring before buying more capacity is the operational best practice that separates controlled rollouts from reactive firefighting.
- Collect baseline traffic data (weeks 1–2). Enable NetFlow or sFlow on all WAN and core interfaces. Collect at least two weeks of data to capture business-cycle variation, including month-end processing, weekly backup windows, and peak business hours.
- Map critical applications and their traffic patterns. Identify VoIP, video conferencing, ERP, POS, and backup traffic. Note their source/destination IPs, ports, and protocols. Document their SLO requirements (max latency, max packet loss, min MOS).
- Build classification and marking policies. Write class-maps and policy-maps (or SD-WAN application policies) that match each application class and apply the correct DSCP marking. Test classification accuracy before enabling queuing.
- Set shaping and policing rates. Configure egress shapers to 90–95% of the contracted CIR to leave headroom for carrier policing. Set police ceilings on priority queues at 30–33% of link capacity.
- Lab test the policy. Use a traffic generator or a test environment to verify that priority traffic is served first, that bulk traffic is rate-limited correctly, and that the priority queue doesn't starve other classes during a burst.
- Pilot on one or two sites (weeks 3–4). Deploy the policy to a low-risk site first. Monitor for 72–90 hours before expanding. Collect before/after metrics for each application class.
- Roll out to remaining sites in phases. Group sites by traffic profile and deploy the matching policy template. Avoid rolling out to all sites simultaneously.
- Monitor continuously for 90 days. Track the metrics below and adjust class bandwidths or shaping rates as traffic patterns evolve.
- Document and obtain stakeholder sign-off. Record every change request, the before/after metrics, and the rollback procedure. Present results in a QBR-ready format.
Pilot test criteria:
| Metric | Measurement method | Acceptable threshold |
|---|---|---|
| VoIP MOS | IPSLA or endpoint monitoring | MOS ≥ 3.5 |
| VoIP packet loss | Flow data or IPSLA | < 1% |
| ERP transaction latency | Application APM or synthetic test | Within SLO baseline |
| Queue drop rate (priority class) | show policy-map interface | No drops (police ceiling working) |
| Queue drop rate (bulk class) | show policy-map interface | Drops acceptable; no impact on other classes |
| WAN utilization (peak) | SNMP / NetFlow | < 80% after optimization |
Rollback: before deploying any policy, save the running configuration and document the exact commands to remove the policy-map from the interface. A rollback should take under five minutes. Always test the rollback procedure in the lab before the pilot.
Common causes of link performance problems and how to troubleshoot them
Performance problems on managed links usually have one of six root causes. Knowing which one you're dealing with before touching configuration saves hours.
Common causes:
- Incorrect shaping rates: shaping to a rate higher than the carrier's CIR means the carrier polices your traffic before your shaper does, causing drops you can't see on your own equipment.
- Misclassified traffic: a backup stream in the EF queue, or VoIP traffic falling into the default class because NBAR didn't match the codec. Check DSCP markings end-to-end with a packet capture.
- Bufferbloat: large interface buffers adding hundreds of milliseconds of latency during congestion. Visible as high RTT during link saturation even when packet loss is low.
- Priority-queue starvation: a priority class without a police ceiling consuming the entire link during a burst, starving transactional and bulk classes.
- ISP queue management issues: the carrier is policing or shaping your traffic in ways that don't match your internal policy. Visible as drops at the carrier demarcation that don't appear on your CE interface counters.
- Under-provisioned tunnels: SD-WAN tunnels with a lower effective MTU than expected, causing fragmentation and performance degradation on large-packet flows.
Troubleshooting checklist:
- Check physical layer first: verify interface error counters (
show interfaces), CRC errors, and input errors. A flapping or error-ridden physical link makes QoS irrelevant. - Verify policing and shaping drops: run
show policy-map interfaceon the egress interface. Identify which class is dropping and at what rate. - Inspect DSCP markings end-to-end: capture packets at the CE egress and at a remote site ingress. Verify that DSCP values match what your policy-map is setting. Carriers sometimes remark or zero out DSCP bits.
- Validate queuing behavior: confirm that the priority class is being served and that its police ceiling is triggering correctly. Confirm that bulk classes are being shaped or policed as intended.
- Check for bufferbloat: run a simultaneous ping and bulk transfer test. RTT spikes of more than 5x baseline during saturation indicate bufferbloat.
- Review flow data for anomalies: a sudden spike in a specific protocol or source IP often indicates a misconfigured backup job, a scanning tool, or a security incident.
Escalation guidance:
Involve the carrier NOC when drops appear at the demarcation point but not on your CE interface, when latency is high end-to-end but your local queues are empty, or when the carrier's SLA metrics don't match your measurements. Bring a pcap from the CE egress, interface counter exports, and flow samples covering the problem window. Your own NOC handles everything upstream of the demarcation: policy configuration, classification accuracy, and application-level SLO tracking.
Which tools should you use for monitoring and control?
Tool selection comes down to what question you're trying to answer and how much operational overhead you can absorb. No single tool covers every layer.
Flow collectors and analytics:
- SolarWinds NetFlow Traffic Analyzer is the enterprise standard for flow-based visibility. It ingests NetFlow, sFlow, and IPFIX, produces top-talker and application-breakdown reports, and integrates with SolarWinds NPM for combined flow and SNMP dashboards. Best for teams that need historical trending and stakeholder-ready reports.
- ntopng handles flow and packet analytics with DPI via the nDPI engine, giving application-level classification without relying on port numbers. The community edition is free; the enterprise edition adds alerting, historical storage, and SIEM integration. Strong fit for teams that want granular visibility on a limited budget.
Packet analyzers:
- Wireshark remains the definitive tool for packet-level debugging. Use it when flow data has identified a suspicious flow and you need to see the actual TCP handshake, retransmission pattern, or application-layer exchange. It's not a monitoring tool; it's a diagnostic tool. Run it on a SPAN port or a tap, filter aggressively, and close it when you're done.
SNMP-based NMS:
- PRTG Network Monitor covers SNMP polling, NetFlow collection, packet sniffing, and application monitoring through a sensor-based model. One platform handles interface utilization, flow analysis, and uptime monitoring, which reduces the number of consoles an admin needs to watch. Scales well for mid-size environments; licensing is sensor-count-based.
Integration advice:
Feed flow data from SolarWinds or ntopng into your SIEM for security correlation. Anomalous flow patterns, a host suddenly generating 10x its normal traffic, are often the first indicator of a compromised endpoint or a misconfigured application. Schedule weekly utilization reports from your NMS and include them in QBR decks so stakeholders can see trends before they become incidents. For teams running managed LAN/WAN solutions, integrating flow telemetry into a NOC dashboard gives the operations team the context to act before a user calls.
When should you apply controls vs. provision more capacity?
Policy controls and capacity upgrades solve different problems. Applying controls to a structurally under-provisioned link delays the inevitable; upgrading capacity on a link that just needs better scheduling wastes money.
Business triggers for enabling controls:
- Recurring SLA violations or SLO breaches that correlate with specific traffic types or time windows.
- User complaints about VoIP quality or application slowness that coincide with backup or patch windows.
- Cost constraints that make a capacity upgrade impractical in the near term.
- Planned migrations to cloud or UCaaS that will change the traffic mix significantly.
Technical thresholds:
- Sustained utilization above 70–80% during business hours is the standard threshold for action. Below 70%, controls are preventive; above 80% sustained, controls alone may not be enough.
- Recurring queue drops on any class during business hours indicate that the class is under-provisioned relative to its demand.
- MOS below 3.5 for voice traffic during business hours is a hard trigger for QoS review.
- Repeated SLO breaches on transactional traffic despite correct classification and queuing indicate a capacity problem, not a policy problem.
Rules of thumb:
- If utilization spikes are predictable and time-bounded (backup windows, patch cycles), fix the schedule first. Rescheduling is free.
- If utilization is persistently above 80% after rescheduling and policy optimization, upgrade capacity.
- If a single application class is causing problems, fix its classification and queuing before assuming the link is too small.
- Prefer policy first; upgrade when policy has been correctly applied and the problem persists.
Enterprise multi-site example and operational playbook
A realistic multi-site deployment follows a structured sequence, not a single configuration push. Here's how a managed provider approaches it.
Site audit and baseline (weeks 1–2): visit or remotely audit each site's current configuration, carrier contracts, and traffic mix. Enable NetFlow on all WAN interfaces. Identify sites with the highest utilization, the most SLO breaches, and the most user complaints.
Policy templates (weeks 2–3): build a conservative template (prioritize voice and ERP, shape bulk to 20% of CIR, no policing on priority queue yet) and an assertive template (add priority-queue policing, tighter shaping on bulk, WRED on TCP classes). Start with the conservative template.
Pilot site (week 3–4): deploy to one site with a known performance problem. Monitor for 72–90 hours. Collect before/after MOS, queue drop rates, and SLO breach rates. Adjust the template based on results.
Full rollout (months 1–3): deploy in groups of 5–10 sites per week. Monitor centrally. Escalate any site that shows unexpected behavior within 48 hours of deployment.
QBR reporting: present per-site SLO breach rates, MOS trends, and utilization trends to stakeholders quarterly. Include before/after comparisons from the pilot phase.
SLA and NOC monitoring:
- Monitor 24/7 for interface utilization above 85%, queue drop rates above a defined threshold, and MOS below 3.5.
- Alert thresholds should trigger the NOC, not just log to a dashboard.
- Escalation paths: NOC handles policy and application issues; carrier NOC handles physical and demarcation issues.
- SLA metrics to track: availability (99.99% data, 99.999% voice), SLO breach rate per application class, mean time to restore (MTTR), and MOS for voice.
SDN-enabled orchestration supports on-demand QoS parameters including minimum and maximum bandwidth and burst sizes, which makes controller-driven policy enforcement across dozens of sites operationally feasible in a way that manual per-device configuration is not.
Pro Tip: Always deploy the conservative policy template first. It's far easier to tighten a policy that's working than to recover from a policy that's starving critical traffic. Add the police command to the priority queue in the second phase, after you've confirmed that the priority class is correctly classified and that its traffic volume is within the expected ceiling.
What running bandwidth management at scale actually looks like
The gap between a well-designed policy and a well-operated network is wider than most teams expect. Policy design is a one-time effort; operations is continuous.
A managed network operator's daily routine involves reviewing overnight telemetry for utilization anomalies, checking queue drop reports for any class that exceeded its threshold, and verifying that MOS scores for voice stayed above 3.5 across all sites. Runbooks cover the most common failure modes: a site whose backup job ran during business hours, a new application that wasn't classified correctly, a carrier that remarked DSCP bits after a maintenance window.
The operational burden on in-house IT teams running this across 20, 50, or 100 sites is significant. Maintaining classification accuracy as applications change, keeping policy templates current as carrier contracts are renegotiated, and producing QBR-ready reports for stakeholders all require dedicated time and tooling. Californiatelecom's model removes that burden: one provider, one bill, one engineer's number, and a 24/7 NOC watching the telemetry so your team doesn't have to.
How Californiatelecom handles bandwidth management for multi-site businesses
Multi-site managed SD-WAN from Californiatelecom means your QoS policies, traffic classification, and carrier-rate shaping are designed, deployed, and monitored by engineers who do this every day, not configured once and forgotten. Californiatelecom sources from 50+ carriers, so your per-site CIR is matched to the best available circuit, and failover policies are tested before they're needed.The operational model is straightforward: Californiatelecom's NOC monitors your WAN 24/7, alerts on utilization and MOS thresholds, and escalates to the carrier when the problem is at the demarcation. You get strong uptime guarantees on data and voice, backed by real engineers, not a ticketing queue. For multi-location businesses that need nationwide managed network services without the overhead of managing 50 carrier relationships and a stack of monitoring tools, that's the practical alternative to building it yourself. Request a free design review and see what a properly engineered policy looks like for your specific site mix.
FAQ
What does bandwidth management actually mean?
Measuring and controlling the traffic on your links through classification, shaping, policing, and queuing — in that order of operations: measurement before policy, classification before queuing, and continuous monitoring before any capacity decision.
How do you find out who is using your bandwidth?
Flow telemetry (NetFlow, sFlow, IPFIX) plus sampled packet captures give the fastest path to root cause: flow records show who and what — source, destination, protocol, port, bytes — while captures show why and how at the packet level.
When should you apply traffic controls versus buying more capacity?
They solve different problems. Applying controls to a structurally under-provisioned link only delays the inevitable; upgrading capacity on a link that just needs better scheduling wastes money. Collect a baseline — roughly two weeks of flow data — before making either call.
What is the biggest bandwidth management mistake?
Skipping straight to policy configuration without data. Baseline first, map the topology, then verify improvements with monitoring before buying capacity — that discipline is what separates controlled rollouts from guesswork.
Sources
- Traffic shaping - Wikipedia
- Intelligent WAN capacity management at Intel
- Top ten ways to optimize network performance | TechTarget
- What is QoS? IT Certification Exam Guide | Courseiva
- Network Bandwidth Monitoring and Management: How to Monitor and Control Traffic | NinjaOne
- 5 challenges in network bandwidth monitoring - ManageEngine NetFlow Analyzer