
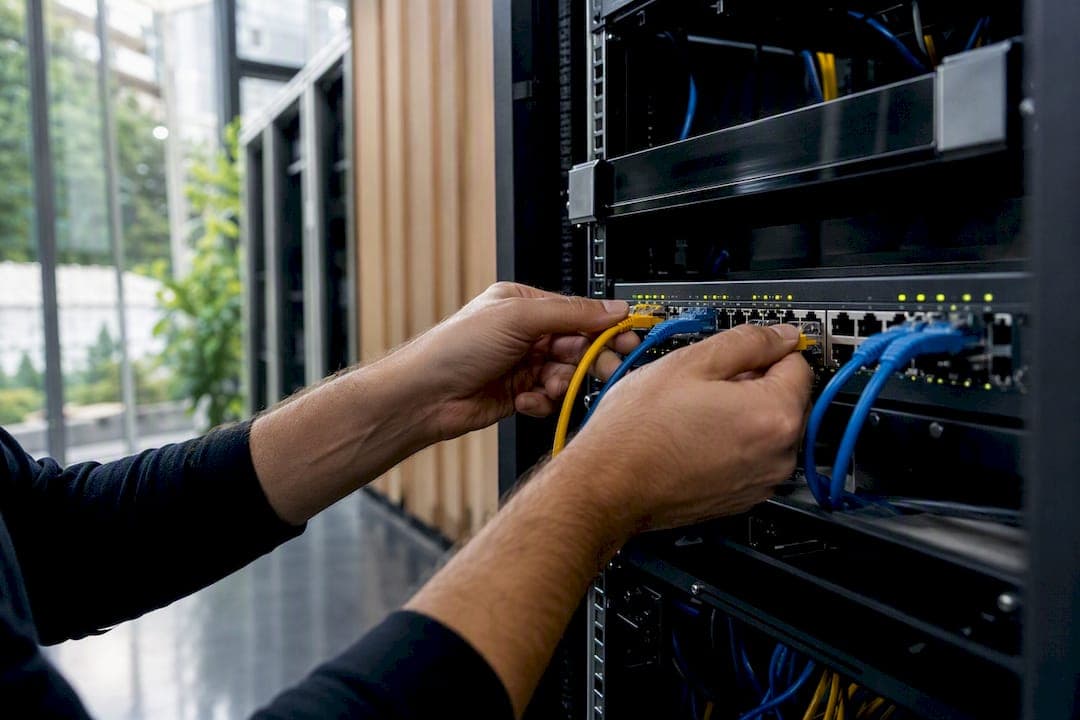
What Are Real-Time Network Alerts, and Why Do They Matter?Real-time network alerts are automated notifications generated from live telemetry, such as SNMP traps, syslog entries, NetFlow records, and IDS signatures, that flag a problem the moment it starts rather than after a customer complains. The value isn't speed alone. An alert that fires in half a second but tells you nothing about why or what to do next is just noise with better timing. The alerts worth building are the ones that carry context and point to an action.
TL;DR:
- Nearly all true alerts should be tied to user impact and service level objectives to reduce false positives and focus on meaningful incidents.
- Routing alerts based on severity ensures that critical issues prompt immediate response, while less urgent ones go to repository systems like ticketing or dashboards.
- Automations should handle straightforward, high-confidence responses like black hole routing, with clear safeguards, reserving human oversight for ambiguous or sensitive scenarios.
- Effective alert tuning involves deduplication, grouping, and periodic review, with metrics tracking the percentage of alerts that lead to actionable resolution.
- A comprehensive runbook should include symptoms, verification steps, mitigation commands, rollback procedures, and post-incident notes to streamline incident resolution.
Table of Contents
- What generates real-time network alerts?
- How should alerts route to the right team?
- What makes an alert actually actionable?
- How do you tune alerts to fight alert fatigue?
- What should you automate, and what needs a human?
- What belongs in your alert runbook and rollout checklist?
- How does California Telecom put these practices into action?
- What do practitioners get wrong about alert design?
- Ready to fix your alert pipeline? Here's where to start
- Sources
What generates real-time network alerts?
Real-time alerts come from wherever telemetry is already flowing, not from some separate detection layer bolted on afterward. Most environments pull from a handful of standard sources:
- SNMP traps for device-level events like interface flaps or fan failures
- Syslog for OS and application-level events across routers, switches, and servers
- NetFlow or IPFIX for traffic volume, direction, and pattern anomalies
- sFlow for sampled packet-level visibility on high-throughput links
- Streaming telemetry and agent metrics for CPU, memory, and latency data pushed continuously rather than polled
- IDS/IPS signatures for known attack patterns and policy violations
Alerts typically fall into four buckets: threshold-based (a metric crosses a fixed line), anomaly-based (behavior deviates from a learned baseline), event-driven (a discrete thing happened, like a BGP session drop), and security-specific (a signature match or policy breach). Correlation engines and dynamic baselining increasingly blend these categories, comparing current behavior against historical norms instead of a static number someone picked two years ago.
How should alerts route to the right team?
An alert that reaches nobody accountable might as well not have fired. The routing layer, separate from the detection layer, decides who sees what and how urgently, and treating those as one system is a common design mistake in early monitoring builds, per guidance on modern alerting architecture.
Channel choice should match severity, not habit:
- Pager-style tools (PagerDuty and similar) for anything that breaks an SLA
- Slack or Teams channels for degraded-but-stable conditions
- Ticketing systems for non-urgent, track-and-fix issues
- NOC dashboards for continuous situational awareness, not action triggers
Grouping related alerts, inhibiting downstream noise when a root cause fires, and honoring maintenance-window silences all belong at this layer. Ownership needs to be explicit too: a named service owner, a technical owner for the underlying infrastructure, and an on-call rotation with defined escalation timing.
Pro Tip: Write ownership into the alert payload itself, not just a wiki page. If the alert doesn't say who owns it, whoever's awake ends up owning it by default, and that's how burnout starts.
What makes an alert actually actionable?
Most alerting programs fail not because they lack alerts but because too many of them don't tell anyone what to do. Three design principles fix that:
- Tie thresholds to user impact, not raw metrics. SLO-driven alerting, where you alert on error budget burn or latency against a defined objective rather than "CPU over 80%," produces far fewer false alarms because it reflects what customers actually feel, a practice detailed in network monitoring best practices from New Relic.
- Define severity tiers with teeth. A P1 should mean guaranteed page-and-respond within minutes; a P4 should mean it shows up in tomorrow's review. If every alert is "critical," none of them are.
- Attach context automatically. Topology maps, recent config changes, correlated signals from adjacent devices, and a direct runbook link should ride along with the alert, not require a separate lookup during an incident.
Skip any of these three and you get an alert stream that's technically real-time but practically useless.
How do you tune alerts to fight alert fatigue?
Alert fatigue isn't an abstract HR concern. Surveys cited in research on SOC alert triage found A notable portion of security operations staff feel overwhelmed by alert volume, and many report burnout tied to it. A separate multi-year analysis of over 115 million SOC alerts found daily volumes running in the tens of thousands, while true attacks made up a very small fraction of that total, according to an empirical study of SOC alert logs. That ratio is why tuning isn't optional maintenance, it's the core job.
Practical tuning techniques worth building into any alert pipeline:
- Deduplicate near-identical alerts firing from the same root cause across multiple devices
- Group related signals into one incident instead of ten separate pages
- Suppress known-benign triggers with an explicit whitelist rather than a mental note
- Move static thresholds to dynamic baselining where traffic patterns vary by time of day or season
Pair those techniques with a review cadence: scheduled maintenance windows that auto-suppress expected noise, a monthly rule review where owners kill or adjust anything generating more false positives than real incidents, and KPI tracking on false-positive rate and mean time to resolution.
Pro Tip: *Track "percent of alerts that led to action" as a standing metric.
What should you automate, and what needs a human?
Automation earns its keep on repeatable, well-understood conditions where the correct response doesn't change based on context. Volumetric DDoS traffic is the textbook case. Ambiguous, low-confidence, or business-critical situations still need a person in the loop.
Concrete examples of safe automated mitigation:
- Remotely Triggered Black Hole (RTBH) routing to drop traffic destined for an attacked address at the network edge
- BGP FlowSpec to filter specific traffic patterns without a full route change
- Automated firewall rule pushes blocking a confirmed malicious source IP
One documented deployment used a Black Hole Router to absorb a large share of repetitive alerts without human review, handling a large share of filtered Zeek alerts automatically in a study of SOC alert logs. That kind of ratio only works with guardrails: audit logging on every automated action, canary runs before full rollout, approval gates for anything touching production routing, and automatic rollback if a mitigation doesn't resolve the symptom within a set window. Ambiguous cases should escalate to a human with full context attached rather than triggering a guessed automated response, a distinction Kentik's guidance on network monitoring alerts treats as a hard line, not a nice-to-have.
What belongs in your alert runbook and rollout checklist?
Before flipping on new alert policies, work through this sequence:
- Map critical services and the infrastructure they depend on
- Set an SLO for each service, not just a metric threshold
- Assign a named owner to every alert policy, no exceptions
- Tune initial thresholds against at least two weeks of real baseline data
- Attach a runbook link to every alert before it goes live, not after the first incident
- Set a recurring review cadence, monthly at minimum for high-volume policies
A usable runbook needs six things at minimum: the visible symptoms, verification queries to confirm the issue is real, exact mitigation commands, steps to verify the fix worked, a rollback procedure, and a slot for post-incident notes. Guides on network monitoring best practices consistently list device inventory, ownership, and recurring review as the three most-skipped steps, and they're the three that matter most a year in. After rollout, track mean time to detect, mean time to resolve, and percent of alerts requiring escalation versus those closed at tier one.
How does California Telecom put these practices into action?
Netverge, California Telecom's observability platform, centralizes logs and telemetry across every site in a customer's network and applies AI-driven prioritization to cut through raw volume before a human ever sees the alert queue. Instead of a NOC technician scanning a flat list of hundreds of events, Netverge surfaces the incidents most likely to be real and most likely to affect users, closer to what research on machine-learning alert filtering found achievable, with one Netdata-based experiment reaching over 90% accuracy in separating alerts worth surfacing from ones worth hiding.
A few patterns worth adopting even without the full platform:
- Centralize logs before you try to prioritize them, scattered dashboards defeat correlation
- Build severity tiers before automation, not after
- Reserve full managed NOC coverage for teams without 24/7 in-house staffing depth
Teams with strong in-house tooling can adopt the tuning and correlation logic directly. Teams without a dedicated NOC generally see faster payoff handing that layer to a managed provider.
What do practitioners get wrong about alert design?
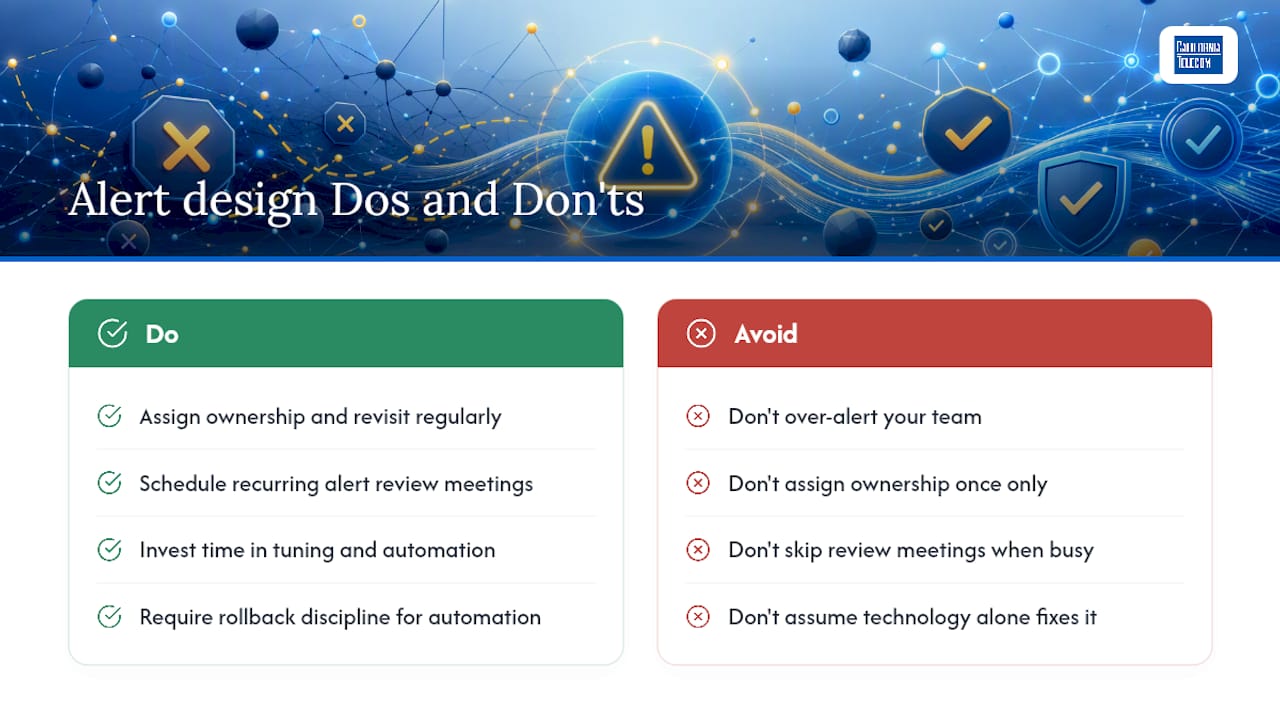
The biggest pitfall isn't under-alerting, it's over-alerting followed by nobody ever going back to fix it. Ownership gets assigned once at launch and never revisited, review meetings get skipped when the team gets busy, and six months later nobody remembers why a threshold was set where it was.
The real trade-offs are uncomfortable ones: more visibility usually means more noise until you invest in tuning, automation buys speed but demands rollback discipline you can't skip, and better alerting often means hiring or contracting for a review process, not just buying a better dashboard. Read enough perspectives on real-time alert value and the same theme surfaces repeatedly: the technology was never the hard part, the discipline to maintain it was.
— Jim
Ready to fix your alert pipeline? Here's where to start
Chasing down noisy alerts across five different vendor dashboards is its own full-time job, and most IT teams already have one. California Telecom's Netverge platform centralizes telemetry from every site into one view and applies AI prioritization so your team sees the ten incidents that matter instead of the four hundred that don't.If your current setup means chasing multiple carriers and absorbing alert overload as the cost of staying connected, a managed network services approach replaces that with one provider, one bill, and one engineer's number. Start with a free consultation to audit your current alert setup and see where centralized monitoring and AI prioritization would cut the noise fastest.
Sources
Recommended
- Real-Time Network Visibility: Find Root Cause Fast with Centralized Logs | California Telecom
- How to Reduce Alert Fatigue: Turning Syslog/SNMP Noise into Priority Incidents with AI | California Telecom
- Netverge: Network Observability | California Telecom
- Netverge Monitoring — AI Solutions | California Telecom